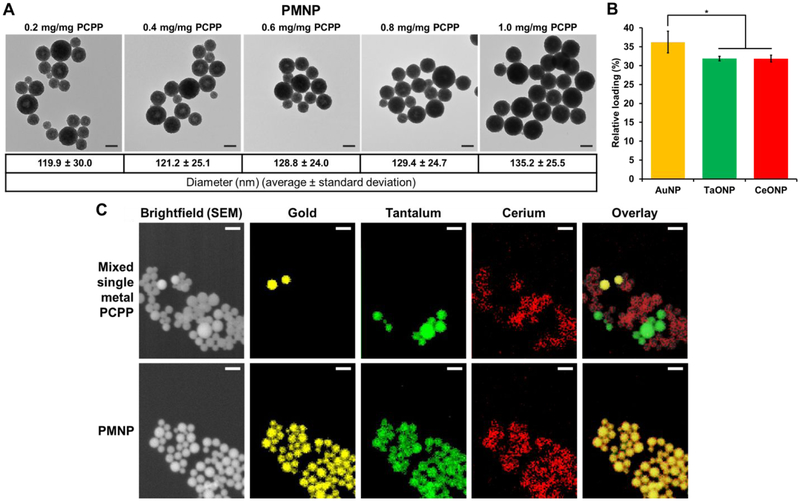
Figure 3. Encapsulation of small core nanoparticles in PMNP.
(A) TEM of PMNP with various loadings of core nanoparticles. Scale bar = 100 nm. (B) Relative percentages of each payload at maximum loading in PMNP (1 mg Au,Ta,Ce/mg PCPP) (* = p ≤ 0.05). (C) SEM brightfield images, EDS mappings of gold, tantalum, and cerium, and overlay images. Scale bar = 200 nm.

