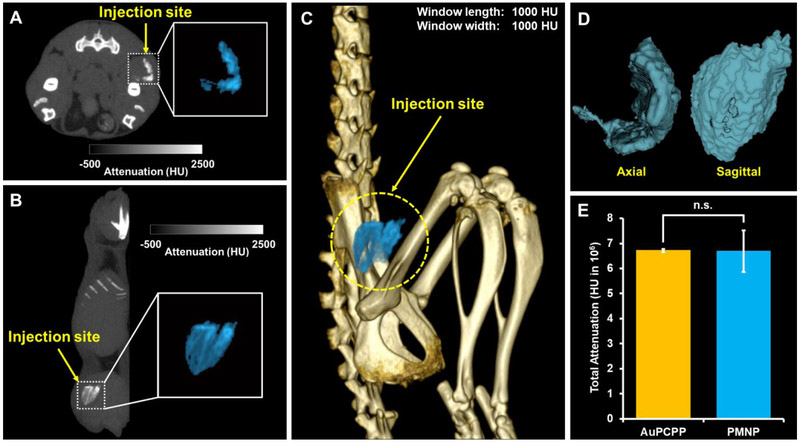
Figure 7. In vivo images and contrast generation analysis.
CT images of PMNP injected in the thigh muscle viewed in (A) axial plane and (B) sagittal plane. Insets represent enlarged images of injected PMNP highlighted in light blue. (C) 3D rendered CT image of a mouse with the PMNP injection site highlighted in light blue. (D) Isocontour depiction of injected PMNP in both axial and sagittal views. (E) Image analysis of the attenuation arising from nanoparticle injections (n.s. = not significant).

