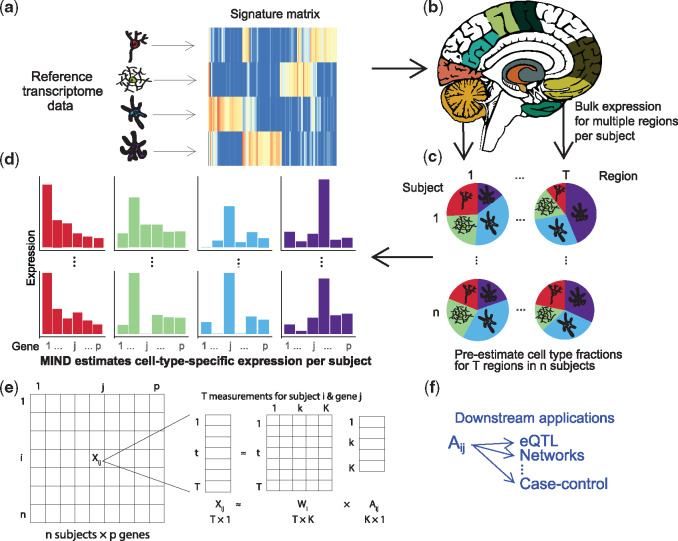
Fig. 1.
Flow diagram for the MIND algorithm. (a) For a set of relevant cell types, select cell type marker genes and build a signature matrix using reference samples. (b) Multiple transcriptomes are measured from each subject; here, one transcriptome for each of multiple brain regions. (c) Using an existing deconvolution method, e.g. non-negative least squares, estimate the cell type fractions for each brain region and subject. Here we depict K = 4 cell types for which their fractions will be estimated per brain region. (d) With results from (b) and (c), MIND estimates cell-type-specific (CTS) expression for each of p genes for each subject and cell type. Colors map to the cell types in (c) and (d) and we depict two of n subjects, 1 and n. (e) Matrix representation of key data elements of the MIND algorithm: for each of T brain regions for subject i, expression of p genes from the transcriptome is measured, ; and the key outputs are the subject level CTS gene expression ( and the subject and measurement level cell type fractions (). (f) Examples of downstream applications for MIND. (Color version of this figure is available at Bioinformatics online.)

