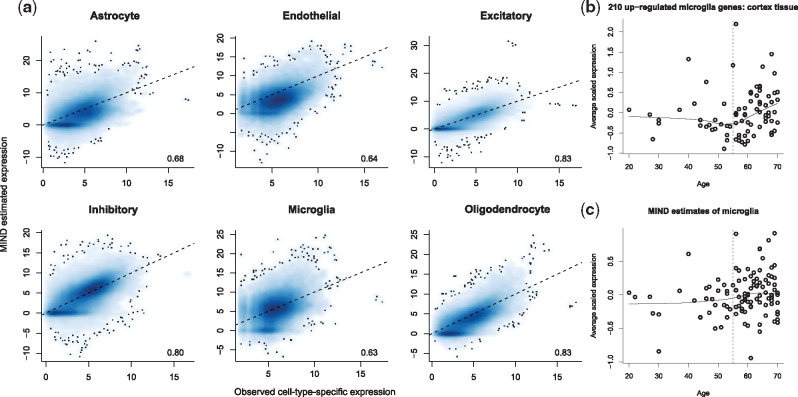
Fig. 3.
Validation of the estimates of MIND. (a) Direct quantification of average gene expression from single cells (observed) (Habib et al., 2017) from GTEx brain samples of the same subjects as the CTS expression estimated by MIND. Shown are scatter plots represented as a smoothed two-dimensional color density. For each panel, correlation for all genes is given. For presentation, only genes with positive observed expression are shown. On average, there are 17 223 out of 31 496 genes that have positive observed CTS expression. Dotted line at y = x. (b) Average scaled expression of microglia marker genes in GTEx cortex tissue and matching the pattern observed by Olah et al. (2018) from different subjects. (c) MIND derived average scaled expression of the same microglia marker genes analyzed in (b) and showing the same pattern of increased expression with age. Expression values in (b) and (c) have been centered

