Fig. 4.
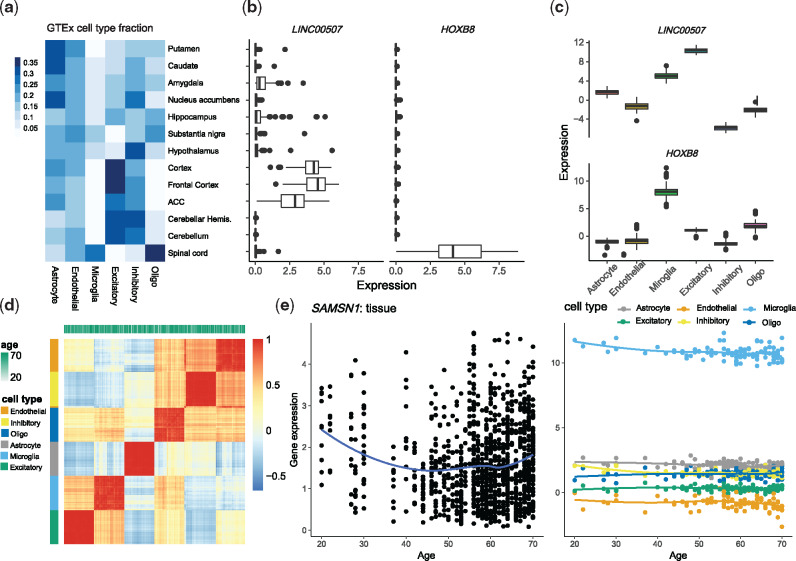
Analyses of CTS gene expression of the GTEx brain data. (a) Estimated cell type fractions in each GTEx brain region, averaged over subjects. Putamen, caudate and nucleus accumbens are the three basal ganglia structures. (b, c) For two transcripts selected for differential expression in cortex versus spinal cord, (b) boxplots of tissue-level expression across brain regions and (c) CTS expression estimated by MIND from tissue-level expression across brain regions. (d) The heatmap and clustering of estimated CTS expression from MIND by cell type and age. Here we visualize a 6n × 6n correlation matrix for the 6 cell types and n = 105 subjects, based on the expression of 124 genes that have the largest variability across brain regions. (e) Age trends for expression of gene SAMSN1 in tissue and its estimated CTS expression from MIND. SAMSN1 is a known marker gene for microglia and is down-regulated in aged microglia (Olah et al., 2018)

