Fig. 3.
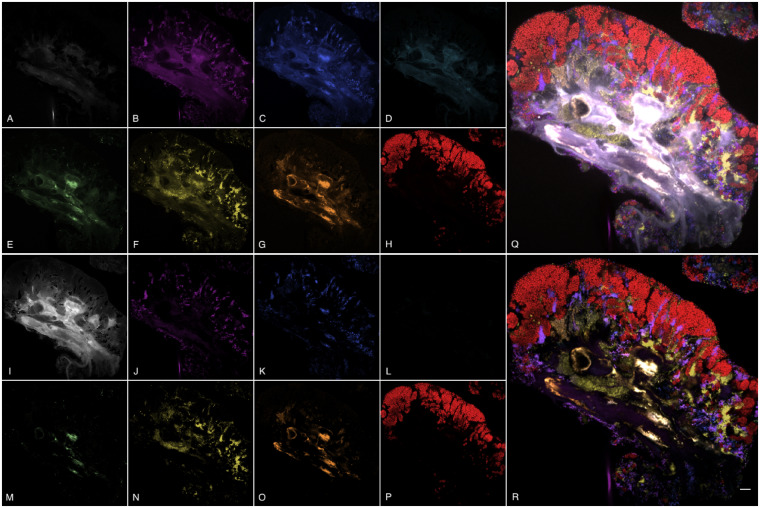
Montage of unmixed images for NLS (top) and SSASU (bottom). Panels (A–P) show the unmixed channels for autofluorescence (A, I); S. mitis/DY-415 (B, J); S. salivarius/DY-490 (C, K); Prevotella/ATTO 520 (D, L); Veillonella/ATTO 550 (E, M); Actinomyces/Texas Red-X (F, N); Neisseriaceae/ATTO 620 (G, O); and Rothia/ATTO 655 (H, P). A larger composite view of the non-autofluorescence unmixed channels is shown for NLS in panel (Q) and for SSASU in panel (R). The scale bar in panel R indicates 10 μm. (Color version of this figure is available at Bioinformatics online.)

