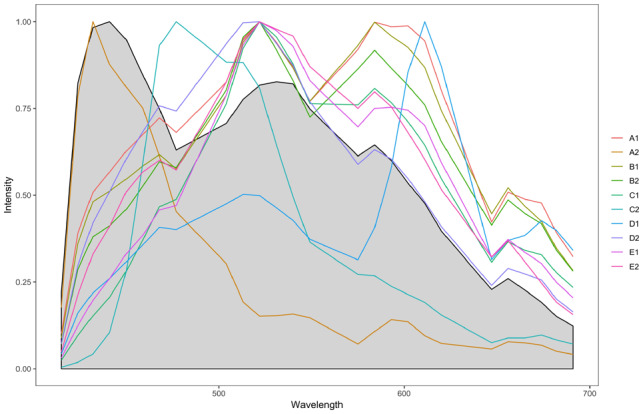
Fig. 4.

Comparison of the autofluorescence endmember estimated from the no-probe control reference image (gray region) to the autofluorescence endmembers learned by SSASU from each of the ten test images (colored lines). Note that none of the learned autofluorescence endmembers match the no-probe control endmember estimate. (Color version of this figure is available at Bioinformatics online.)
