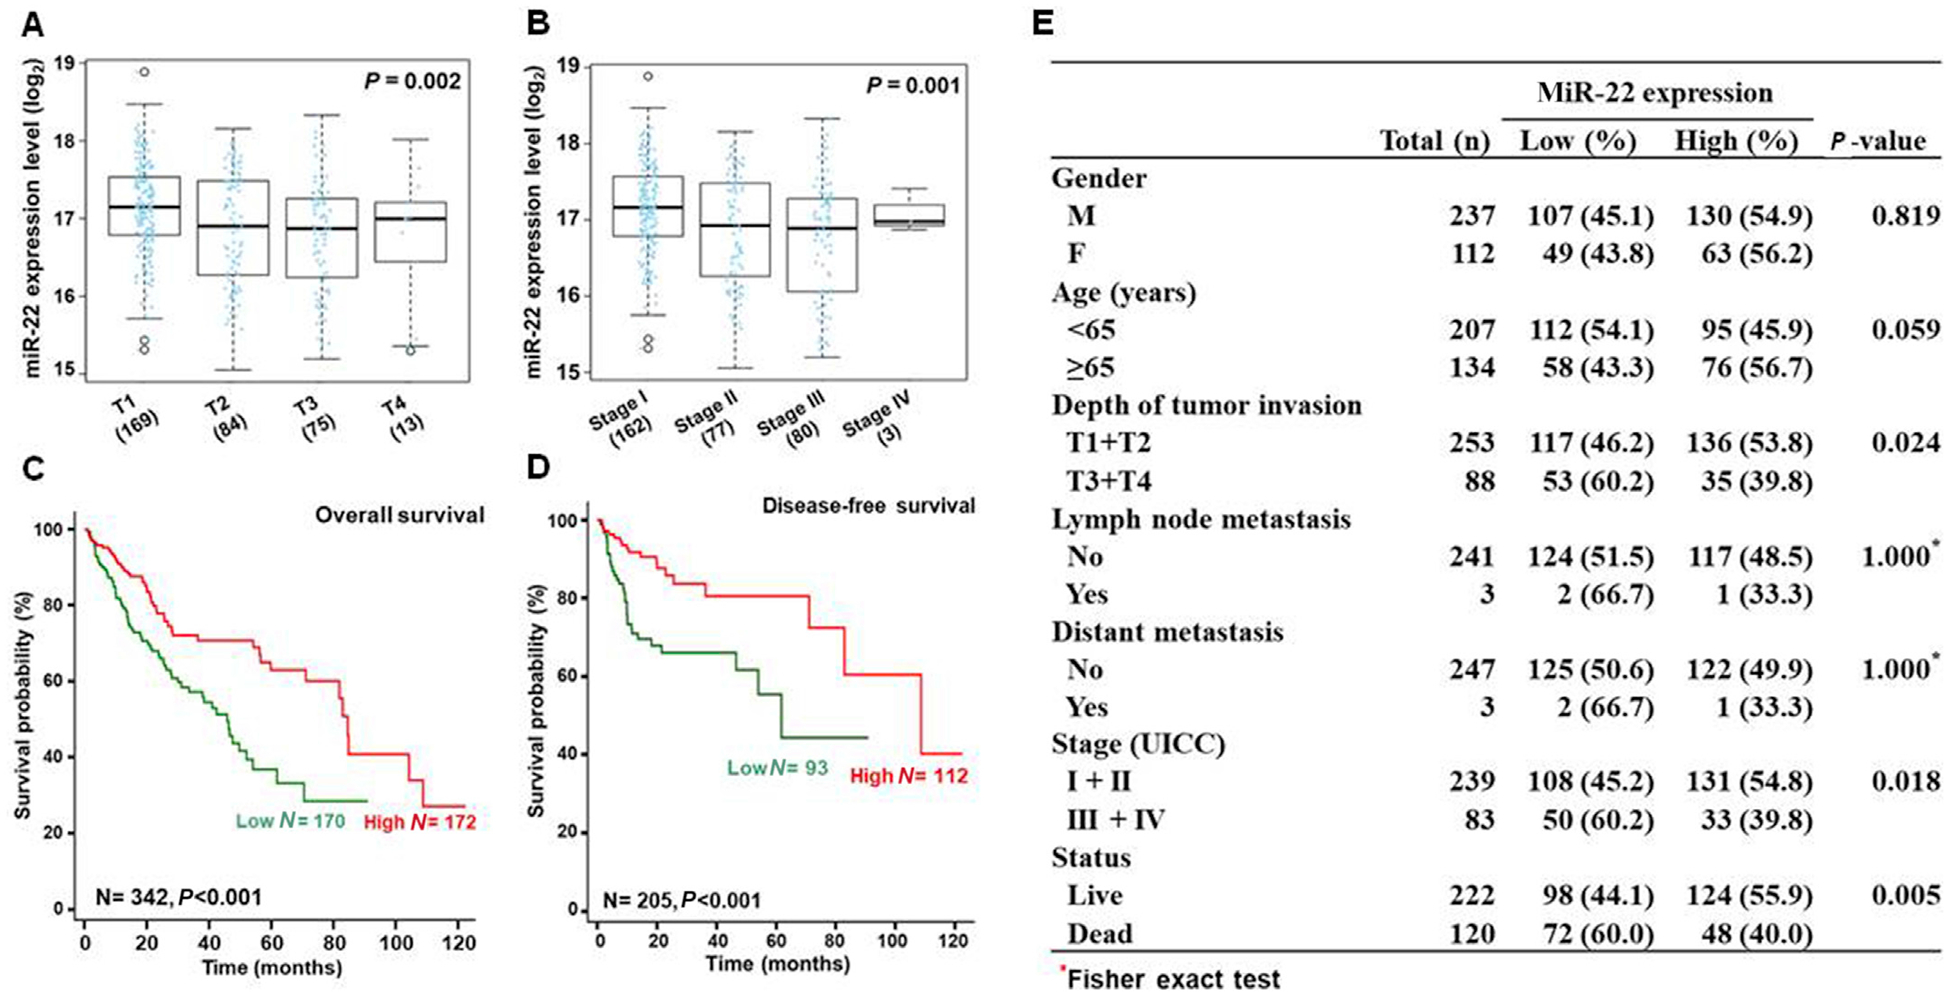
Fig. 2. The associations between miR-22 levels and HCC clinical features.

The correlation between miR-22 expression level (log2) and (A) the depth of tumor invasion and (B) tumor stages. Kaplan-Meier curves showed the relationships between miR-22 levels and (C) overall survival and (D) disease-free survival. P-values were calculated by the log-rank test. Clinical features and P values are summarized in (E).
