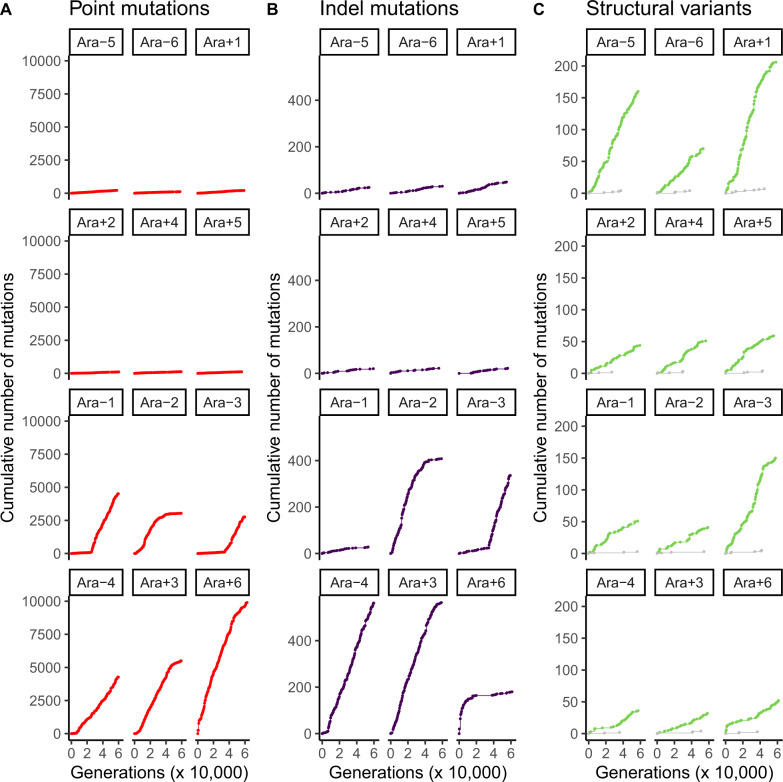
Fig. 1.
Divergent evolution of mutation rates in the LTEE. Each panel shows the cumulative number of observed mutations, subdivided by mutation class, over time in each LTEE population. The top six panels show the nonmutator LTEE populations, and the bottom six panels show the hypermutator LTEE populations. (A) Point mutations are shown in red. (B) Indel mutations are shown in purple. (C) sv associated with transposons are shown in green, whereas those that are not associated with transposons are shown in gray.

