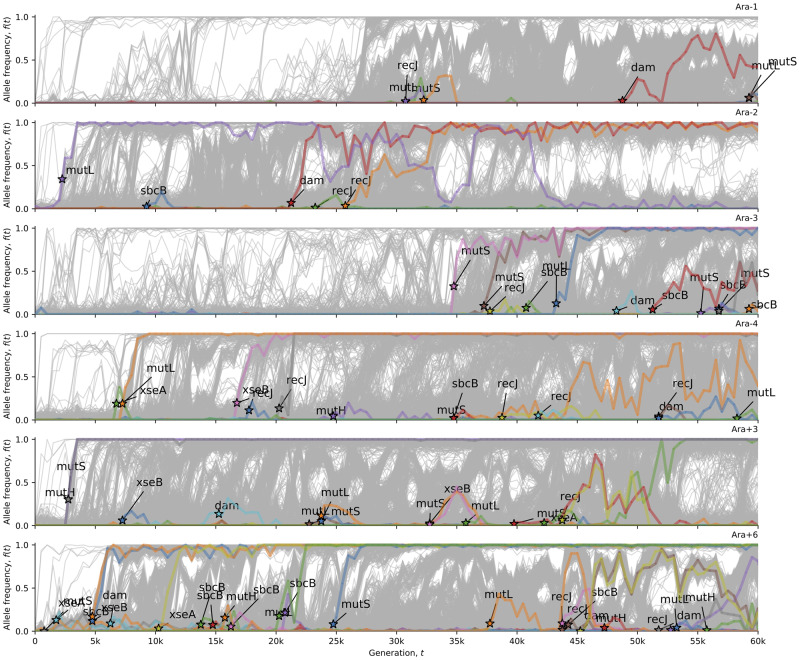
Fig. 4.
MMR alleles in the hypermutator LTEE populations. This visualization uses computer code from Good et al. (2017). Stars indicate the time (and allele frequency) at which mutations are reliably estimated to appear in the time series. The allele frequency trajectories for all observed mutations in the hypermutator populations are shown in gray. The allele frequency trajectories of de novo mutations (except synonymous mutations) in MMR genes (supplementary file 1, Supplementary Material online) are colored and labeled in each population.

