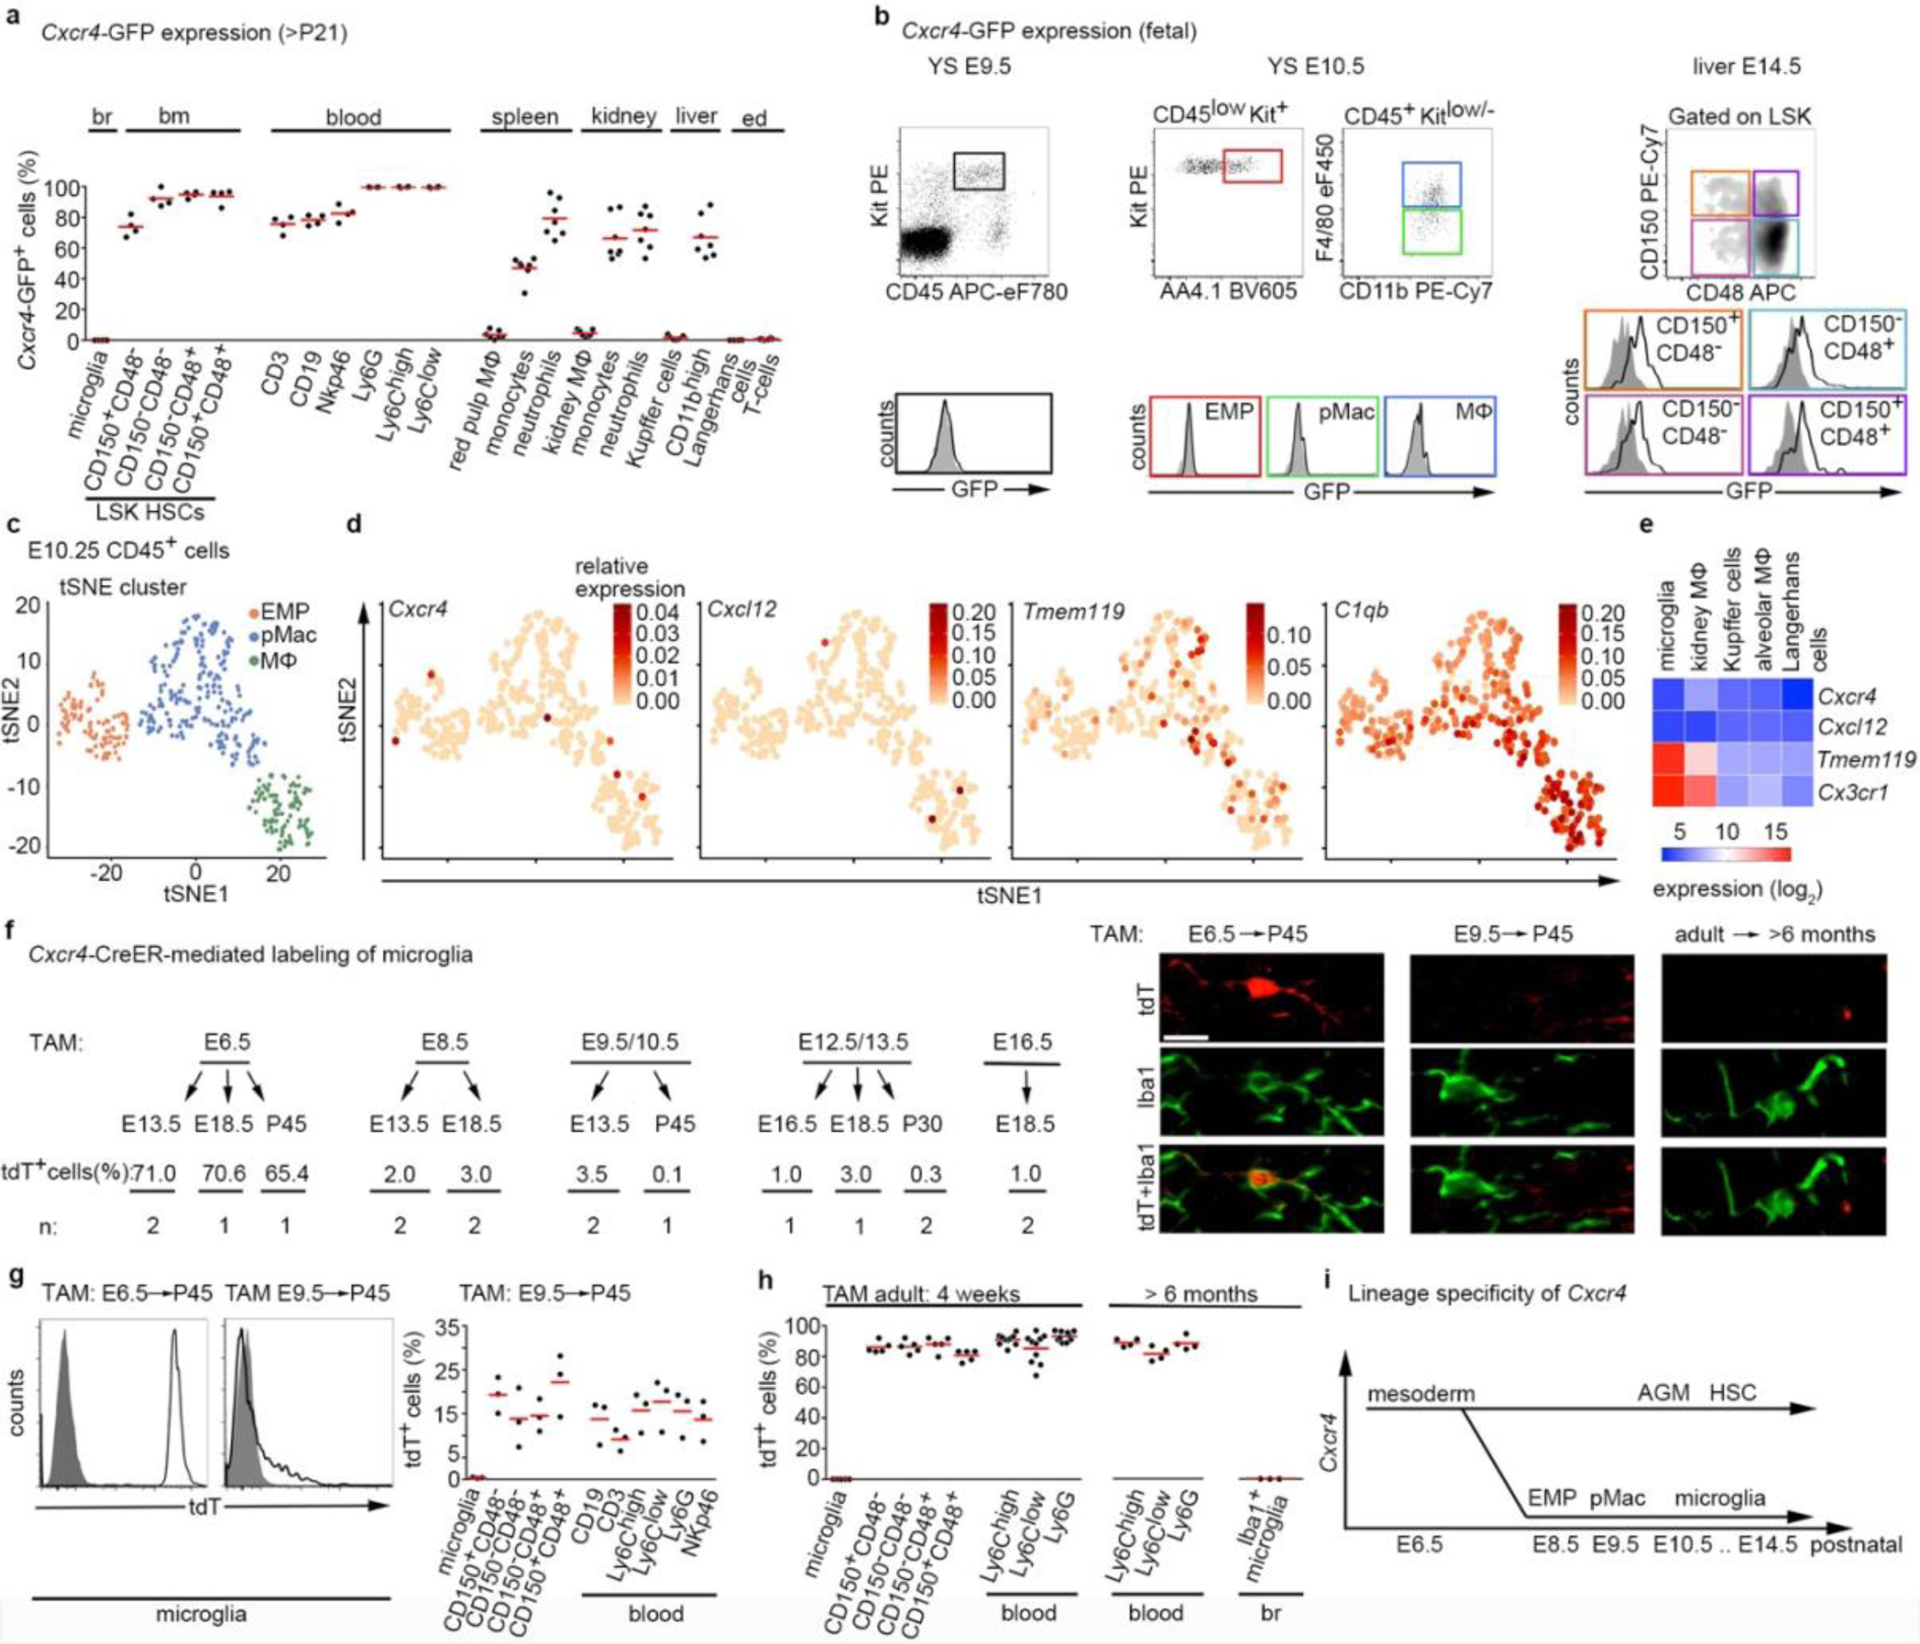
Figure 1.

Developmental expression of Cxcr4 in hematopoietic cells. a, Flow cytometry analysis of GFP in Cxcr4-GFP mice. The graph depicts the GFP+ percentage for microglia (CD11b+CD45low), LSK HSCs, blood leukocytes (CD3+ T-cells, CD19+ B-cells, NKp46+ natural killer cells, Ly6G+ neutrophils and CD115+ Ly6Clow/Ly6C+ monocytes), CD11b+ F4/80high tissue macrophages (MΦ), including Kupffer cells and Langerhans cells and CD11b+ F4/80−/low tissue myeloid cells from Cxcr4-GFP mice (>P21). b, Flow cytometry analysis of GFP expression in hematopoietic cells from fetal Cxcr4-GFP (solid line) and wild-type (filled) mice. Cells analyzed were Kit+ EMPs, F4/80− pMacs and F4/80+ macrophages in E9.5 and E10.5 yolk sac (YS), as well as LSK HSCs in E14.5 liver. c, t-Distributed stochastic neighbor embedding (tSNE) plot of single-cell RNA-seq data showing distribution of CD45low/+ cells from E10.25 embryos into three clusters. Cluster distribution based on DBScan is overlaid onto the graph and corresponds to EMPs, pMacs, and macrophages. d, tSNE plot as in (c), overlaid with the relative expression values for Cxcr4, Cxcl12, Tmem119 and C1qb. e, Heatmap representation of selected genes from bulk RNA-seq of macrophages from indicated P21 tissues. f, Left: contribution of Cxcr4 lineage-derived cells to microglia in Cxcr4CreER/wt;R26CAG-LSL-tdT mice pulsed with TAM at the indicated stages of embryonic development. The tdT signal was assessed by confocal microscopy in ≥100 microglia per mouse. Data represent mean values of the tdT+ percentage (n: number of analyzed mice). Right: confocal micrographs demonstrate double immunofluorescence for Iba1 and tdT. Scale bar, 10μm (applies to all images). g, Left: solid line histograms showing the tdT signal in CD11b+CD45low microglia from E6.5-pulsed and E9.5-pulsed P45 Cxcr4CreER/wt; R26CAG-LSL-tdT mice. Filled histograms show TAM- Cxcr4CreER/wt; R26CAG-LSL-tdT controls. Right: scatter dot plot show the percentage of tdT+ cells for microglia (CD11b+CD45low), LSK HSCs, and leukocyte subpopulations obtained from P45 Cxcr4CreER/wt;R26CAG-LSL-tdT mice receiving TAM at E9.5. h, Percentage of tdT+ cells for microglia, HSCs and leukocytes from Cxcr4CreER/wt; R26CAG-LSL-tdT mice receiving TAM at adult age. Flow cytometry analyses took place 4 weeks and >6 months after TAM as indicated. Iba1+ microglia in the >6 months cohort was assessed by confocal microscopy. i, Schematic summarizing developmental expression of Cxcr4 in the hematopoietic lineages giving rise to tissue-resident macrophages and HSCs. AGM, aorta-gonad-mesonephros. In all graphs, circles and lines represent individual mice and mean values, respectively. Statistics: a, n=6 (brain, BM, blood and epidermis) or 7 (spleen, kidney and liver) mice; b, data are representative for n=5 mice each; c,d, data represent 408 single cells from n = 2 independent experiments with four and six embryos per experiment. e, mean from n = 2 animals and n = 2 technical replicates, except lung, where n = 1 animal and n = 2 technical replicates; g, data for both graphs are representative for n = 3 mice each. h, for analyses at 4 weeks n = 5 (microglia and BM) or 10 (blood) mice; for >6 months: n = 4 (blood) or 3 (microglia) mice. Panel c adapted from 26, with permission from AAAS.
