Extended Data Fig. 3:

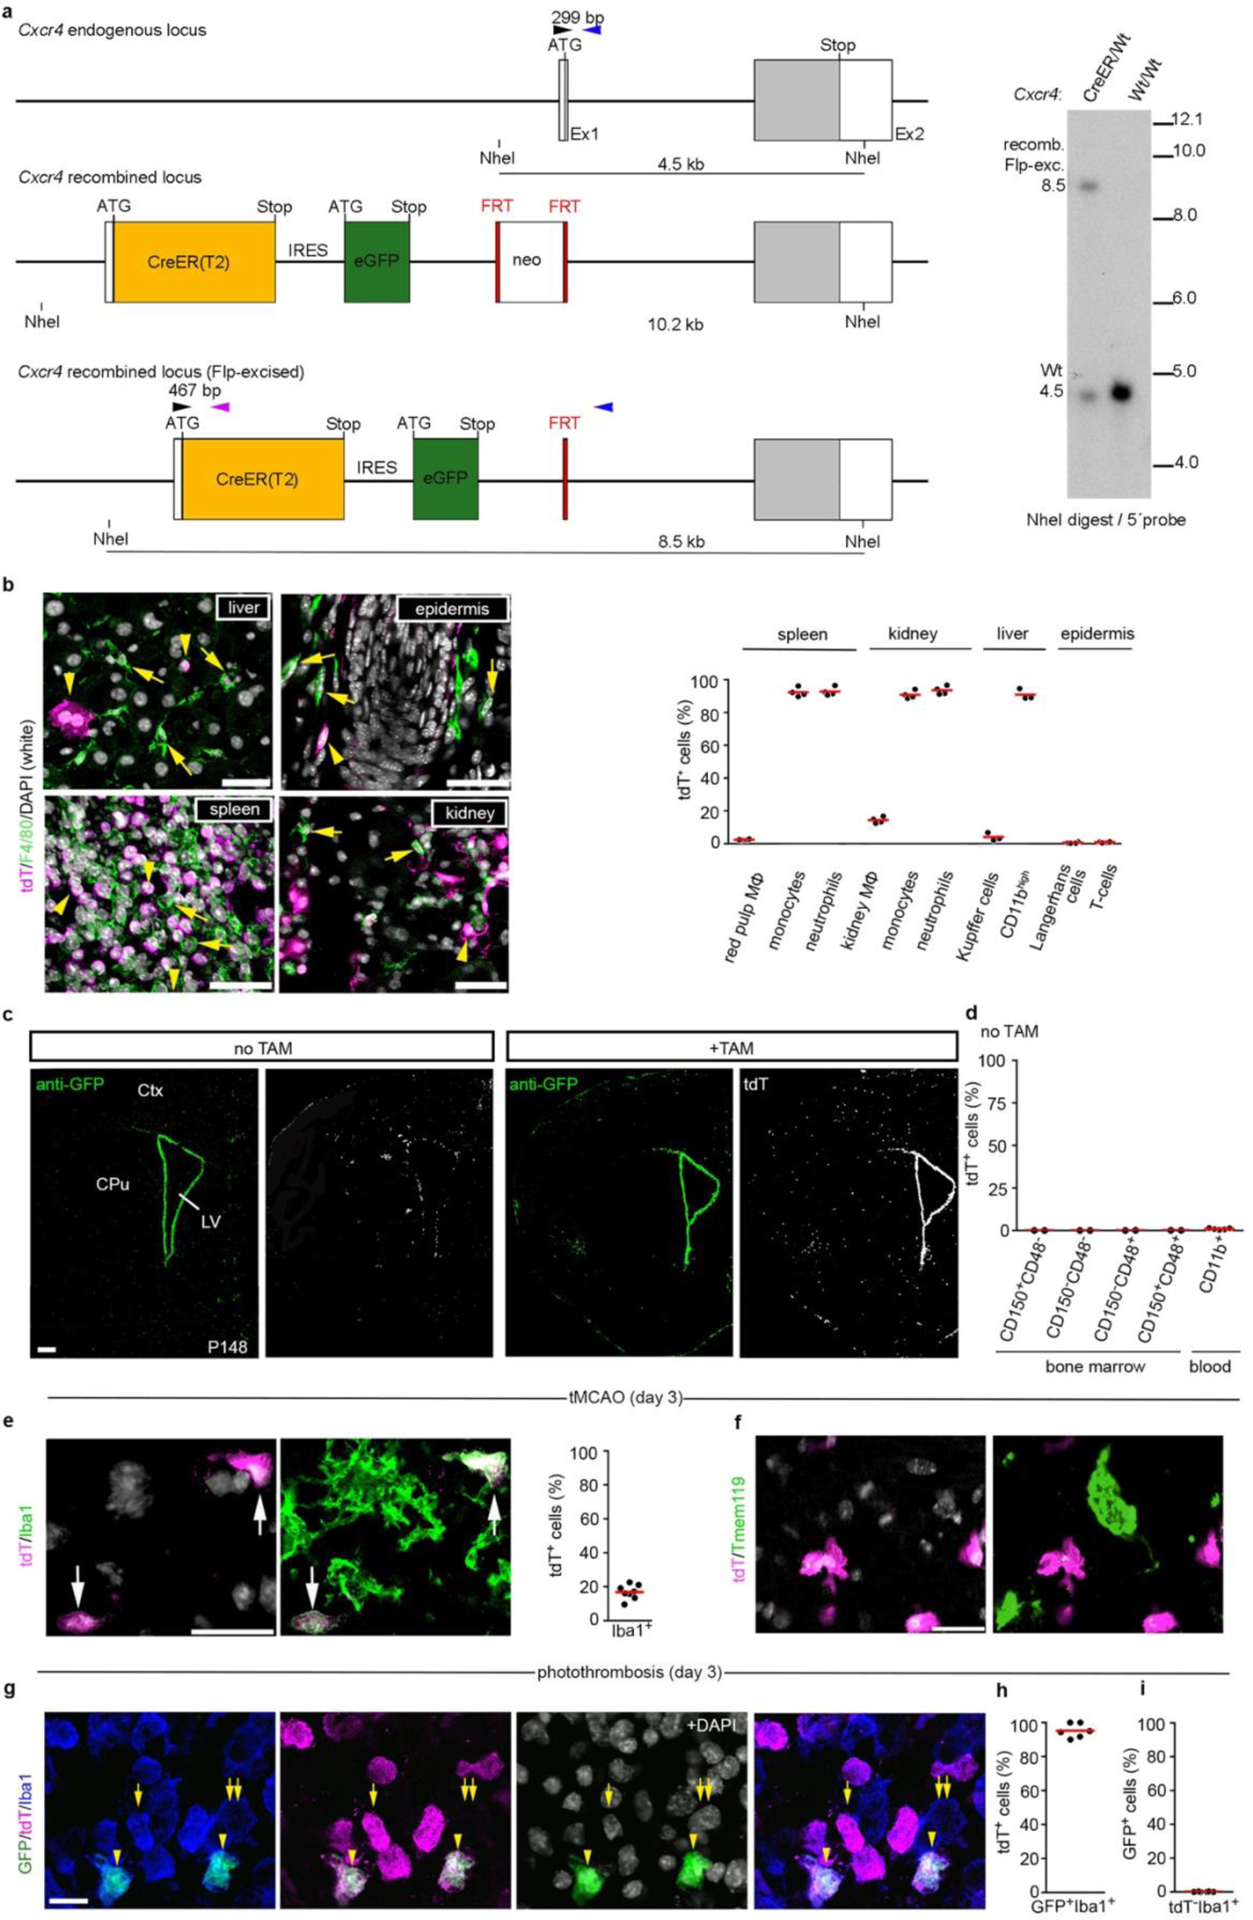
Characterization of Cxcr4CreER/wt; R26CAG-LSL-tdT mice. a, Schematic of the Cxcr4-CreER(T2)-IRES-eGFP allele generated by homologous recombination. Upper panel: Cxcr4 exons 1 and 2 (Ex1, Ex2) with the coding sequence in grey. Middle panel: In-frame fusion of the ATG in exon 1 with sequences for CreER(T2), internal ribosomal entry site (IRES), and eGFP. The insertions disrupt the Cxcr4 coding sequence. A neomycin positive selection cassette (neo) flanked by FRT sequences was placed downstream of eGFP. Lower panel: The recombined allele after excision of neo. Primers used for genotyping (arrowheads): Cxcr4-upper (black), Cxcr4-lower (blue), Cxcr4-CreER-lower (purple); primer sequences are detailed in the Methods. Right panel: Southern blot of NheI-digested genomic DNA hybridized with a 5′ Cxcr4 probe identifies the 8.5 kb Flp-excised Cxcr4-CreER fragment and the 4.5 kb Cxcr4 wild-type fragment (blot is representative for n=7 mice). b, Analysis of tdT signal in tissue MΦ and blood cells in adult mice 4 weeks after TAM. Immunofluorescences show tdT (magenta) and F4/80 (green) in the indicated tissues with DAPI in white. Arrowheads identify tdT+ F4/80− cells and arrows tdT− F4/80+ cells. Images are representative for n=3 mice. The graph shows flow cytometry analyses of the tdT+ percentage for the indicated cell types (spleen, kidney, and epidermis: n=4 mice; liver: n=3 mice). c, Immunostained Cxcr4-IRES-GFP and tdT in TAM-naïve (−TAM) and TAM-treated (+TAM) P148 mice receiving TAM from P113–P11 (images are representative for n=3 mice each). d, The graph shows the tdT+ percentage for LSK HSCs (n=2 mice) and CD11b+ blood cells (n=5 mice) in adult TAM-naïve (−TAM) condition. e–g, Stroke was induced by tMCAO or PT in adult mice ≥28 d after TAM treatment. Micrographs show dual immunofluorescences for tdT/Iba1 (e, representative for n=8 mice) and tdT/Tmem119 (f, representative for n=8 mice) in the striatal infarct 3 days after tMCAO and a triple immunofluorescence for Cxcr4-IRES-GFP/tdT/Iba1 in the cortical infarct 3 days after PT (g, representative for n=6 mice). DAPI appears white. Graphs depict the tdT+ percentage for Iba1+ cells (e, n=8 mice) and for GFP+ Iba1+ cells (h, n=6 mice) as well as the GFP+ percentage for tdT− Iba1+ cells (i, n=6 mice). Graphs: Circles and red lines represent individual mice and mean values, respectively. Scale bars: 40 μm (b), 500μm (c), 40 μm (d), 20 μm (e,f), and 15 μm (g).
