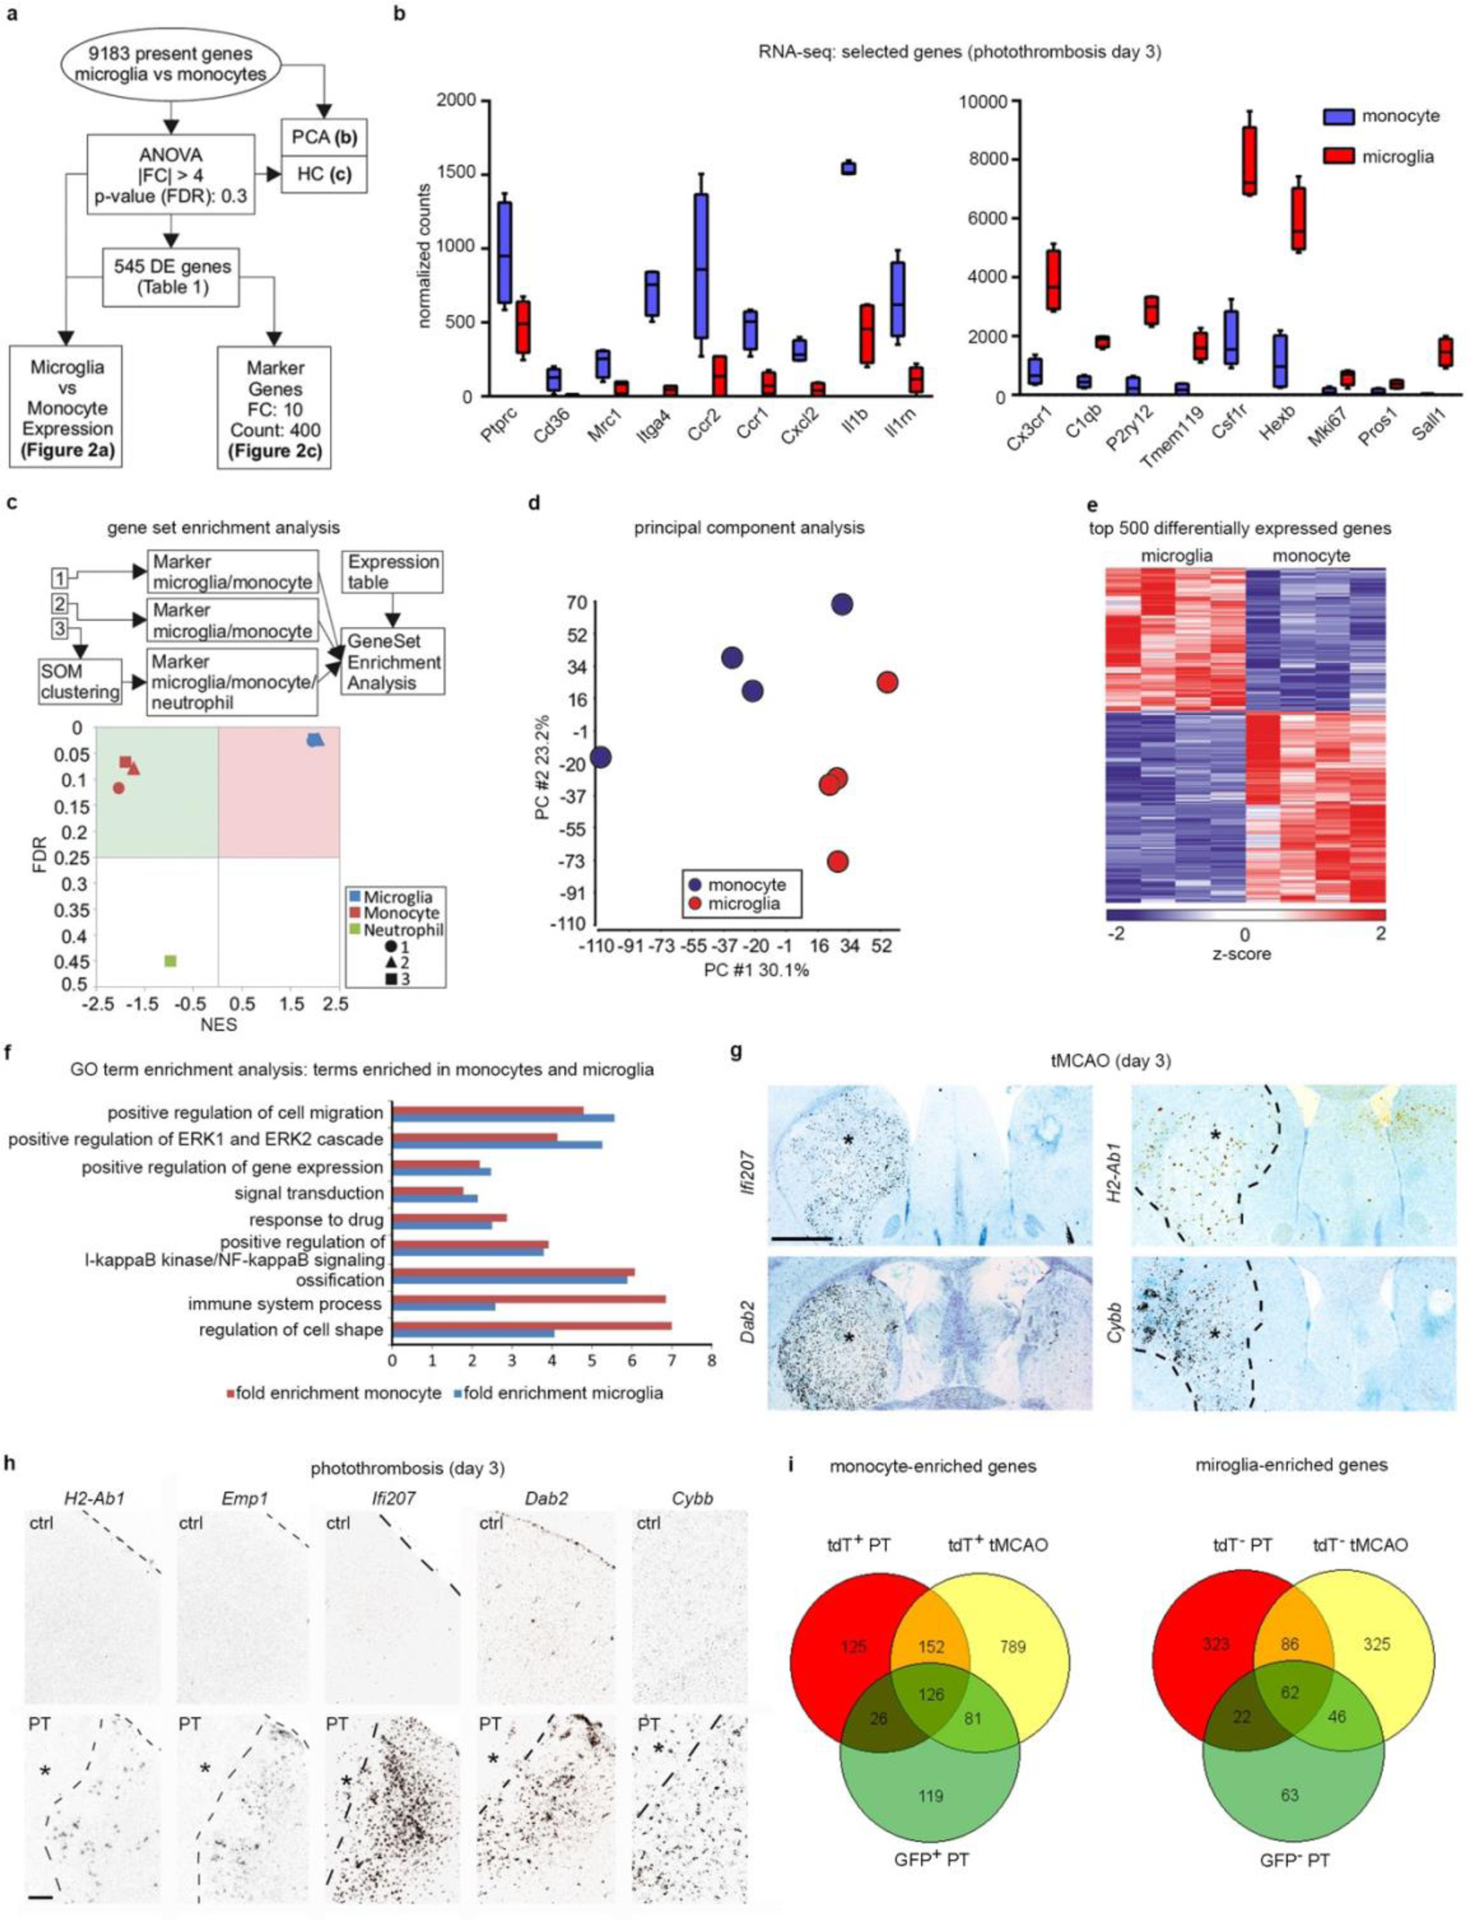
Extended Data Fig. 4:

RNA-seq analysis of the gene expression of monocytes and microglia in photothrombotic infarcts. a–f,i, RNA-seq was performed with Cxcr4-GFP+ Ly6Chigh monocytes (Ly6G− CD11b+ CD45high) and Cxcr4-GFP− microglia (Ly6G− CD11b+ CD45low) sorted from the injured cortex at day 3 after PT (n=4 mice). a, Scheme describing the workflow. Differentially expressed (DE) genes were defined by |fold change (FC)|>4 and false discovery rate (FDR)<0.3. Statistical test: one-way ANOVA. b, Normalized RNA-seq counts for the indicated genes (center line, median; box limits, 25th to 75th percentiles; whiskers, min to max) (n=4 mice each). c, Gene Set Enrichment Analysis (GSEA) with all present genes using markers of monocytes, microglia, and neutrophils as gene sets. The plot shows normalized enrichment scores (NES) versus enrichment p-values (FDR). Sources of the marker sets [1] – [3] are detailed in the Methods. Statistical test for nominal p-value of the enrichment score: empirical phenotype-based permutation test. d, Principal component analysis (PCA) with all present genes. e, Hierarchical clustering (HC) showing z-transformed normalized expression values of the top 500 most variable DE genes colored from blue to red. f, GeneOntology (GO) term enrichment analysis of DE genes. Bars depict fold enrichment for terms with p-value <0.05. Statistical test: EASE Scores (one-tail) calculated with DAVID Bioinformatics. g,h, The indicated transcripts were detected by in situ hybridization (black signal). Images depict the ipsilateral CPu after tMCAO (g) and the border zone of the cortical infarct after PT (h). Infarcts are indicated by asterisks. The contralateral side and the cortex of naïve mice (ctrl) serve as references in (g) and (h), respectively. Sections from mice undergoing tMCAO were counterstained with cresyl violet. Images are representative for n=2 (ctrl) and n=3 (stroke). i, Venn diagrams for DE monocyte and microglia genes. The GFP+ monocyte and GFP− microglia gene sets correspond to the data shown in (a). DE genes (|FC|>1.5 and FDR<0.05) for tdT+ monocytes and tdT− microglia were obtained by RNA-seq with cells isolated from Cxcr4CreER/wt; R26CAG-LSL-tdT mice at day 3 after PT (n=3) and tMCAO (n=5). Statistical test: Wald test with likelihood ratio test. See Supplementary Table 4 for lists of the DE genes and intersecting sets. Scale bars: 1000 μ(g), 200 μm (h).
