Figure 2.

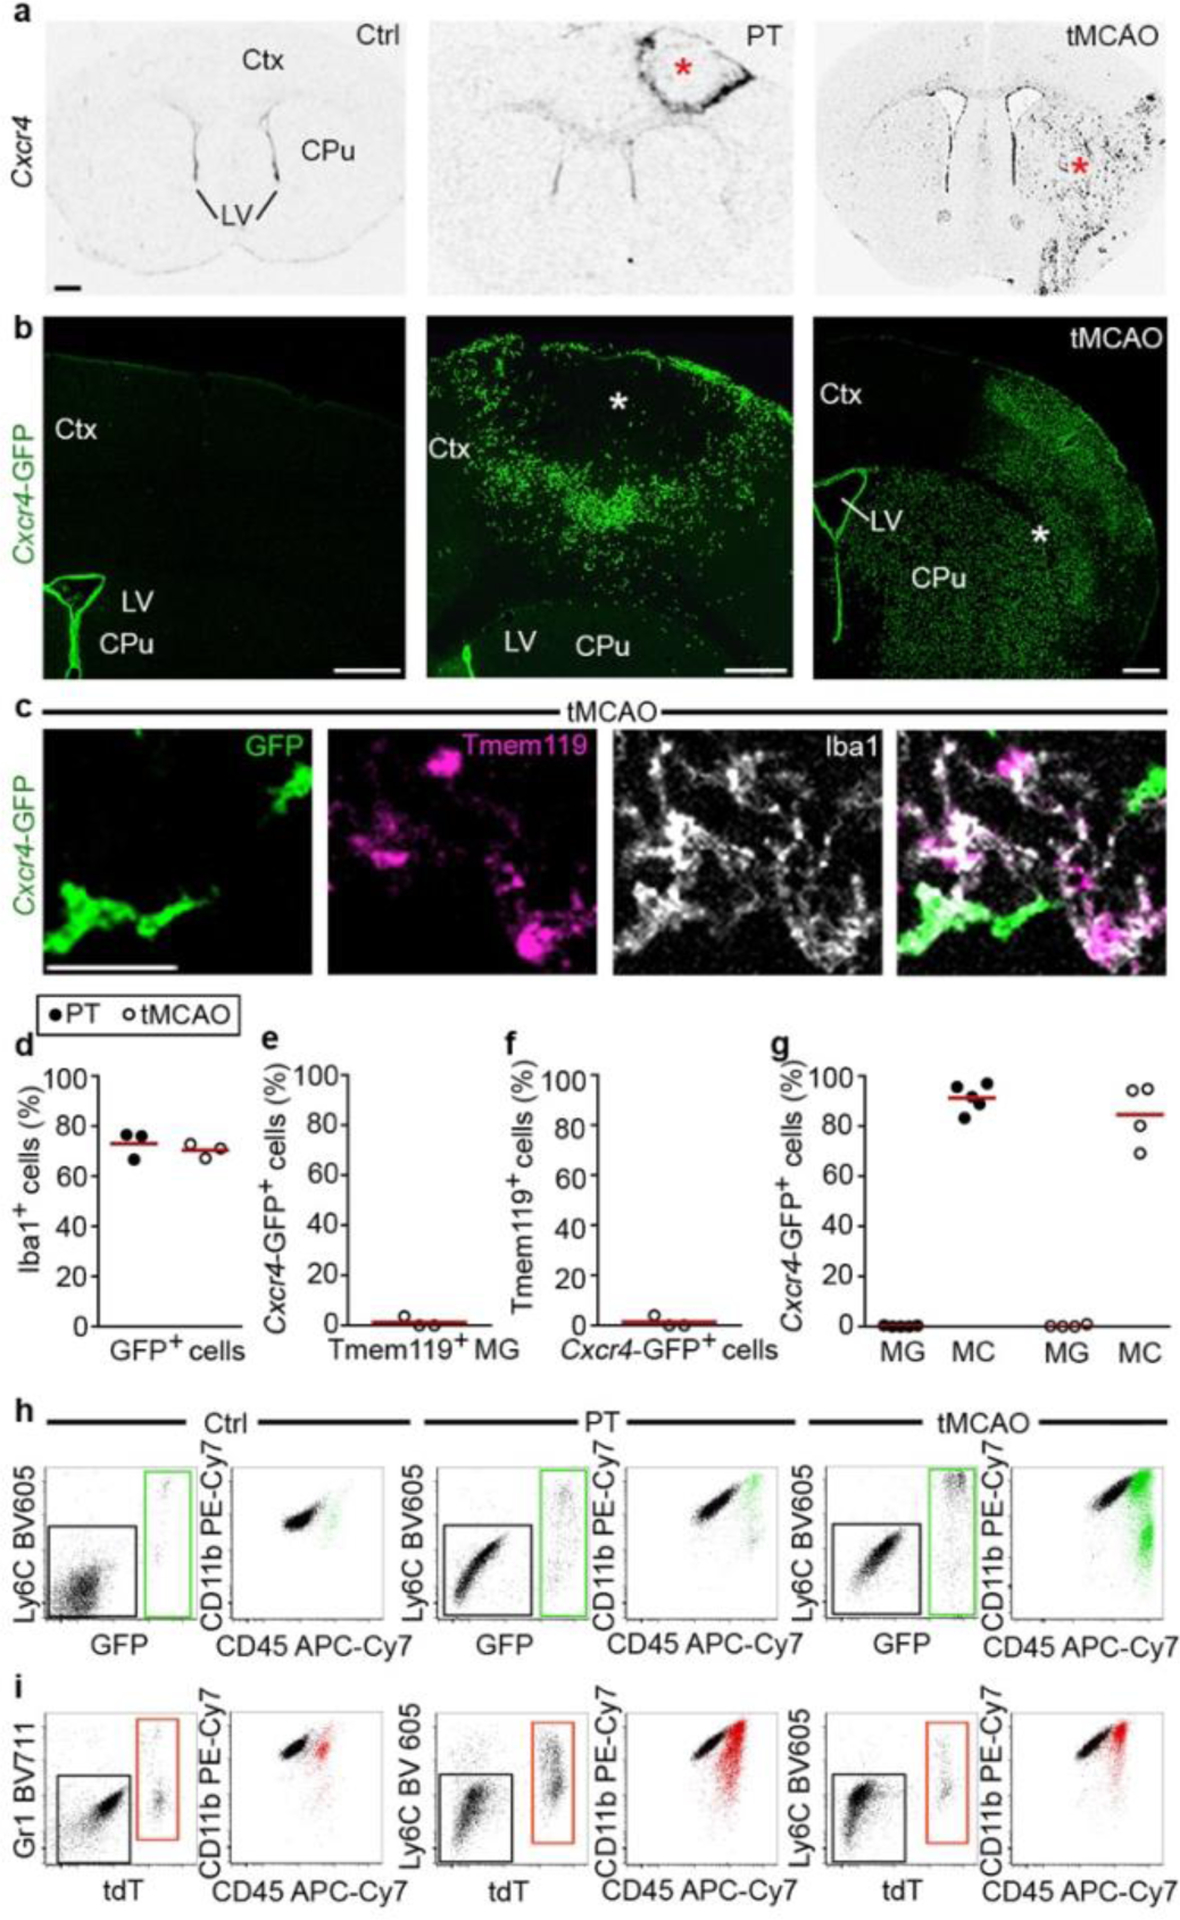
Cxcr4 is differentially expressed in MDMs and reactive microglia at day 3 after stroke induction. a, ISH for Cxcr4 in coronal brain sections of wild-type mice, with the cerebral cortex (Ctx), caudate putamen (CPu) and lateral ventricle (LV) highlighted. Images depict the control condition (Ctrl), PT and tMCAO. b, Immunofluorescence for GFP in Cxcr4-GFP mice. Asterisks in (a) and (b) identify the infarct territory. Scale bar, 500μm (applies to all images in (a) and (b)). c, Confocal images showing triple immunofluorescence for GFP, Tmem119 and Iba1 in the infarct of a Cxcr4-GFP mouse undergoing tMCAO. Scale bar, 45μm. d–f, Overlap of Cxcr4-GFP with Iba1 and Tmem119 in the infarct territory as determined by confocal microscopy. Graphs show the Iba1+ percentage for Cxcr4-GFP+ cells (d), the GFP+ percentage for Iba1+Tmem119+ microglia (e) and the Tmem119+ percentage for GFP+ Iba1+ cells (f). Keys in (d) applies to (e) – (g). g–i, Immunophenotyping of GFP+ cells (green) from Cxcr4-GFP mice (g,h) and tdT+ cells (red) from Cxcr4CreER/wt;R26CAG-LSL-tdT mice (i) using CD11b, CD45 and Ly6C/Gr1 as markers. Phenotyping was performed with CD3-CD19-Ly6Glow cells from the telencephalon under control conditions and from the affected brain area after PT or tMCAO. Data in g show Cxcr4-GFP+ percentages for microglia (MG: CD11b+CD45low) and monocytes (MC: CD11b+CD45highLy6Chigh). For all graphs, circles and lines represent individual mice and mean values, respectively. Statistics: a–c, Data are representative for n≥3 mice each; d–f, data represent n=3 mice; g, data represent n=5 (PT) or 4 (tMCAO) mice. h,i, data are representative of n=6 (i, Ctrl), 5 (i, PT), 4 (i, tMCAO), 4 (h, Ctrl), 8 (h, PT), or 6 (h, tMCAO) mice.
