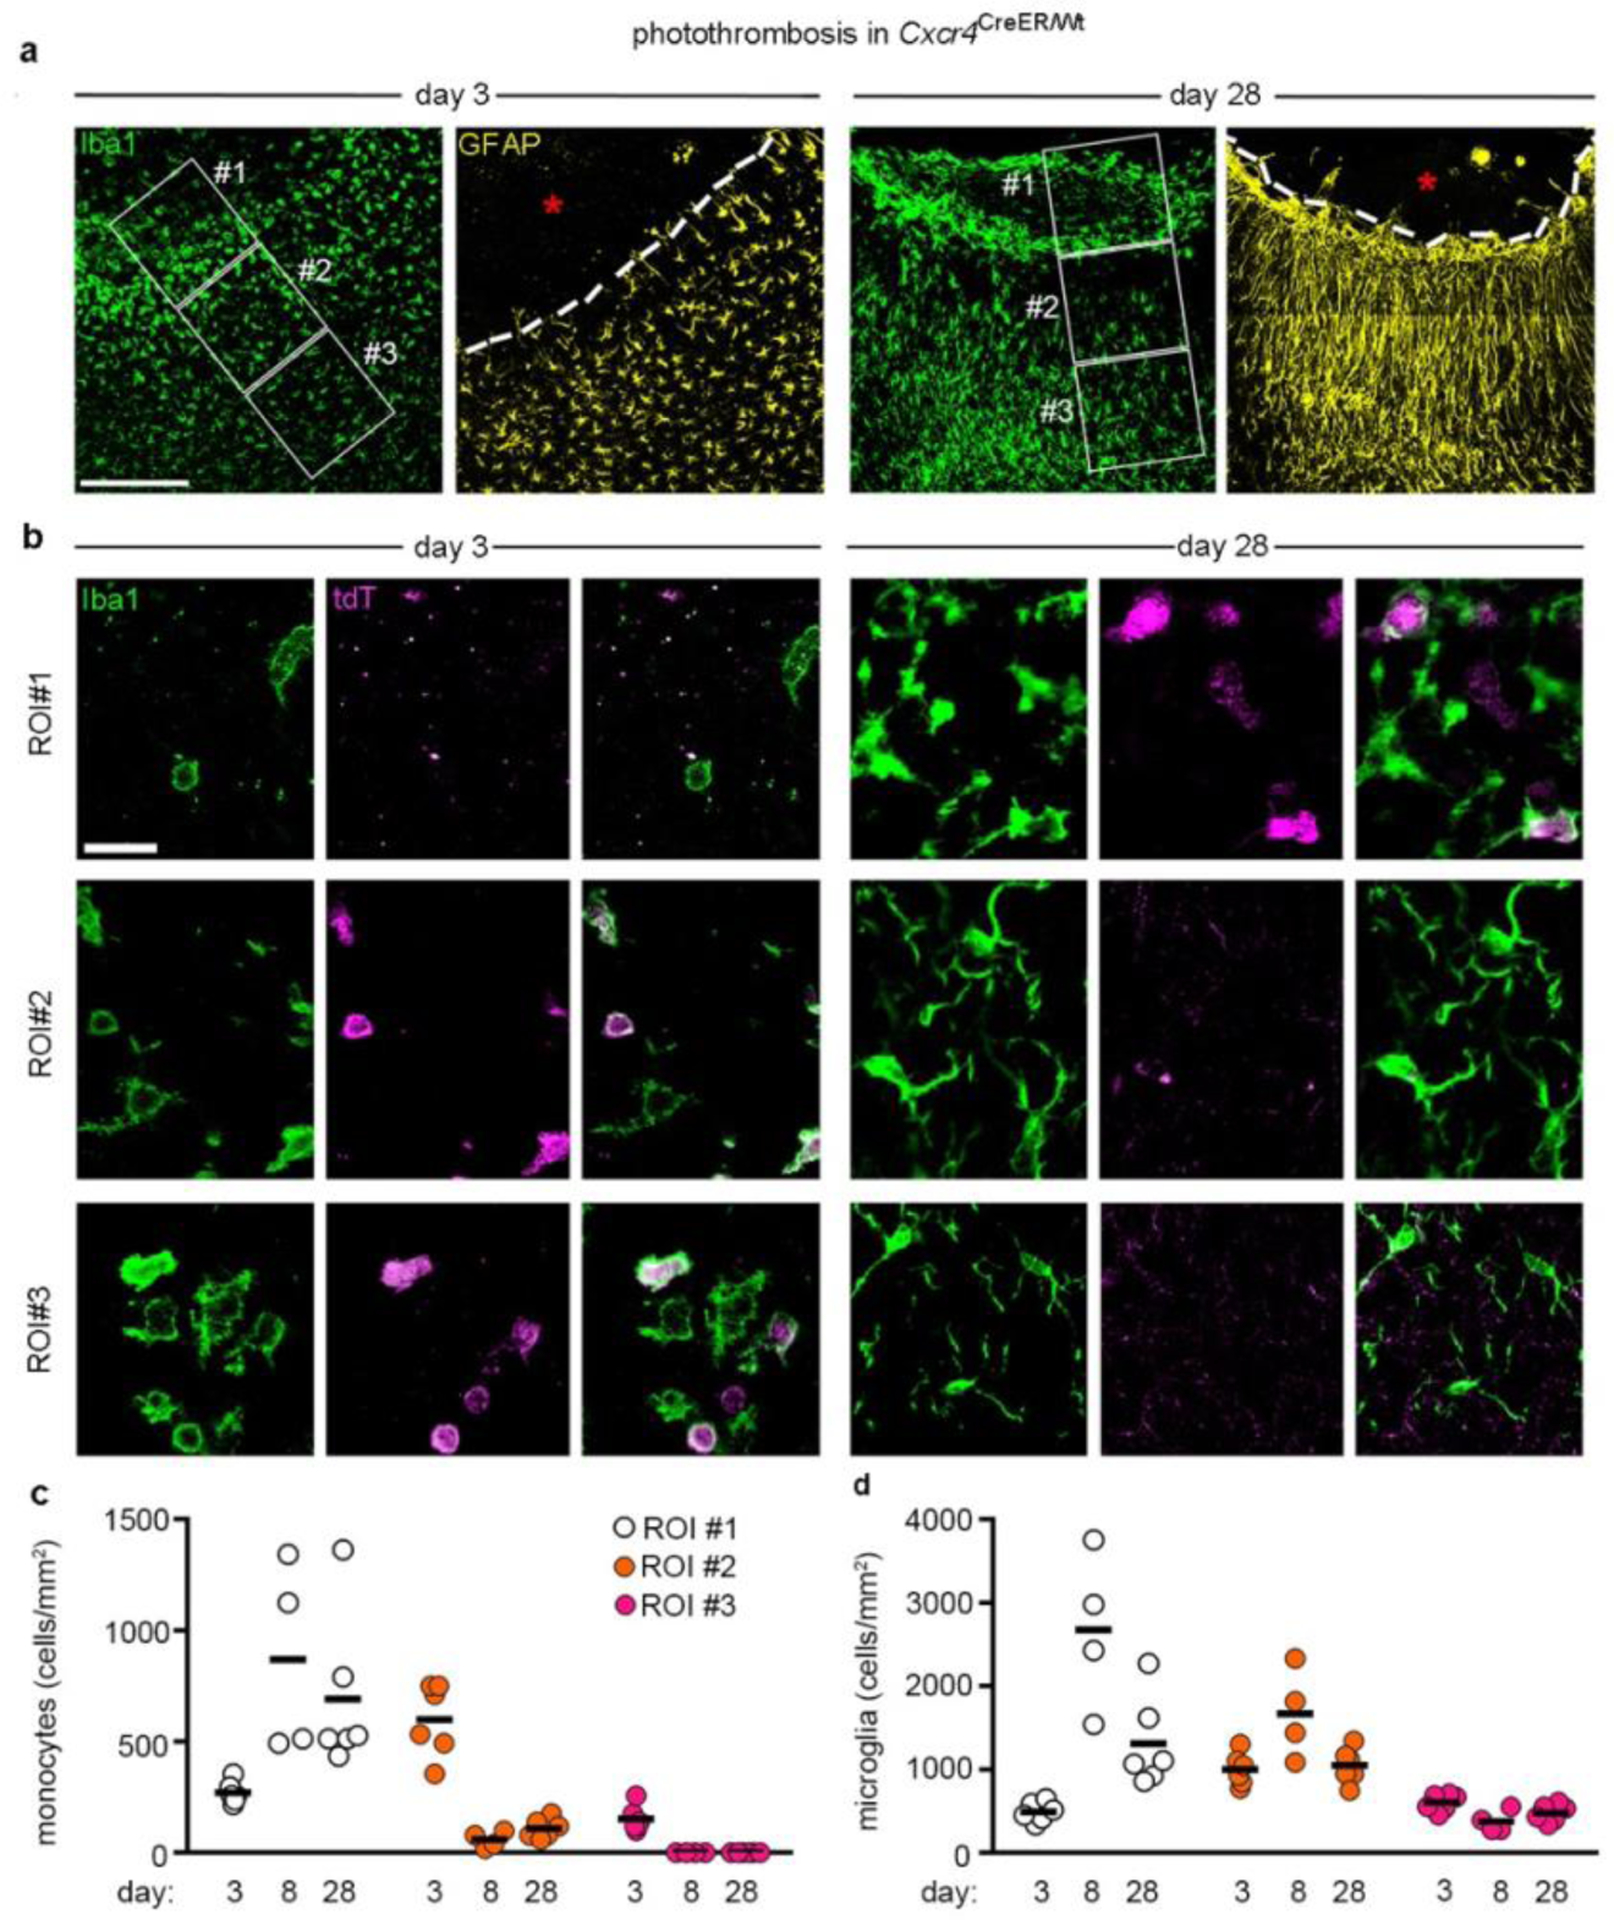
Figure 4.

Monocytes do not persist in the peri-infarct area. a, Iba1 and GFAP immunofluorescence in the infarct boundary zone of Cxcr4CreER/wt; R26CAG-LSL-tdT mice at days 3 and 28 after PT. Iba1 and GFAP are depicted separately for the same section. The segmented line segregates the infarct from the boundary zone. Framed areas represent ROIs 1–3. Asterisks mark the infarct center. b, Confocal images demonstrate tdT+ Iba1+ monocytes and tdT− Iba1+ microglia in ROIs 1–3 at post-operative days 3 and 28. Images in (a) and (b) are representative for n=6 mice for both days 3 and 28. c,d, Graphs depicting the density of tdT+ Iba1+ monocytes (c) and tdT− Iba1+ microglia (d) in ROIs 1–3 at post-operative days 3, 8 and 28. Circles and lines represent individual mice and mean values, respectively. n=6 (day 3), 4 (day 8) or 6 (day 28) mice. Scale bars: 225 μm (a) or 25 μm (b).
