Figure 6.

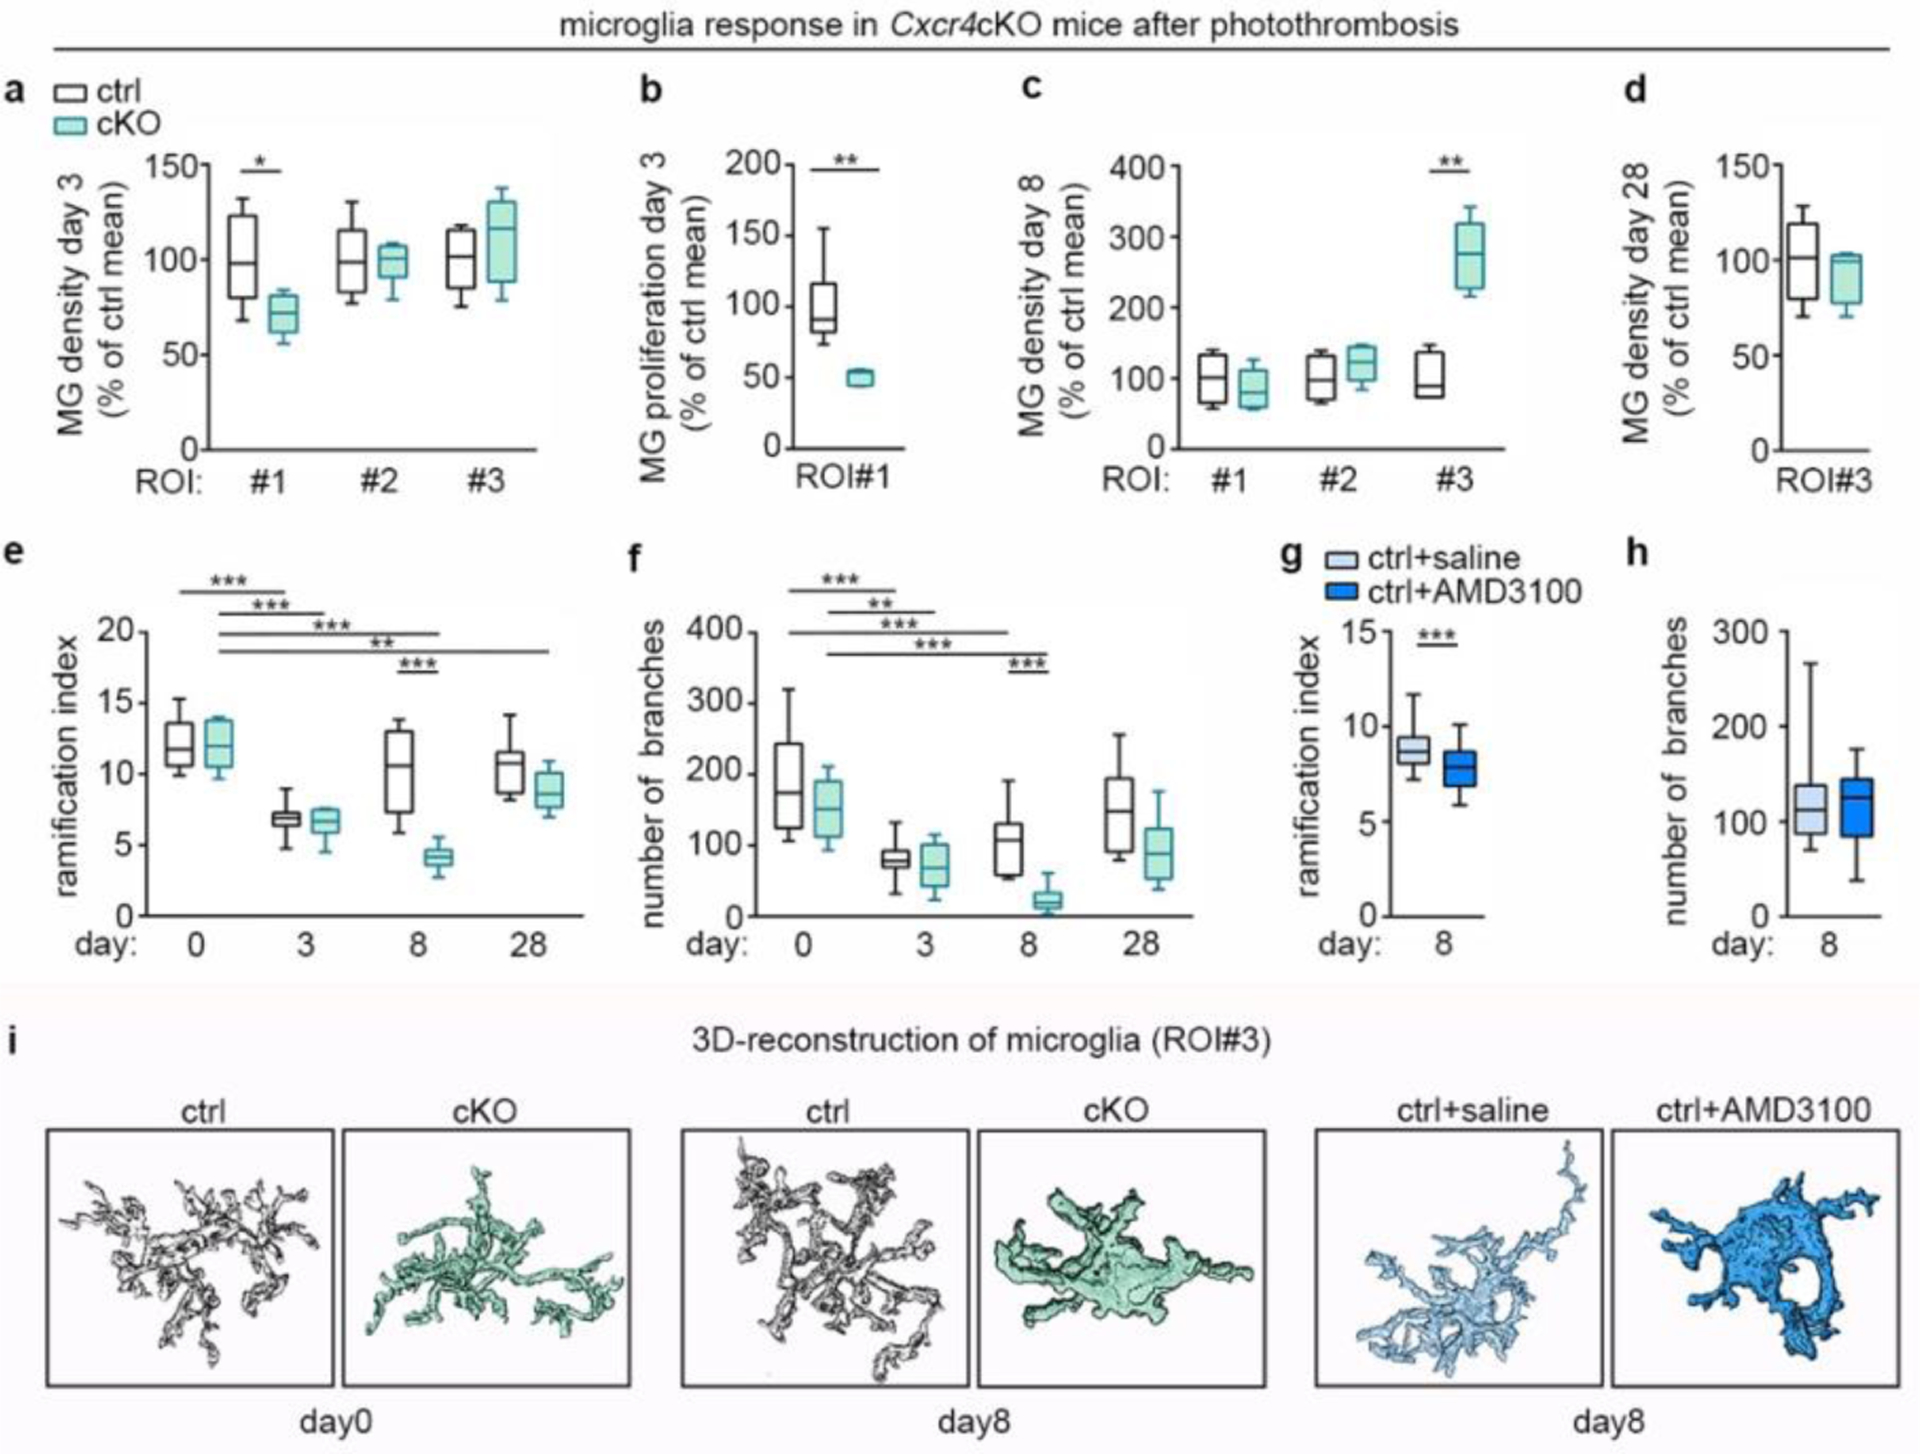
Cxcr4-deficiency affects the microglia response after PT. tdT− Iba1+ microglia were examined in the indicated ROI in Cxcr4 control and Cxcr4 cKO mice at days 3, 8 and 28 after PT using confocal microscopy. In (e), (f) and (i) day 0 represents the non-stroke condition. ROIs are illustrated in Fig. 4a. a–d, Microglia density and Ki67+ percentage of microglia in the infarct. e–h, Ramification index and number of branches of 3D-reconstructed microglia in the peri-infarct region (ROI 3). Data in g and h represent control mice receiving intra-infarct application of saline or Cxcr4 antagonist AMD3100 6 h before analysis. i, Images of 3D-reconstructed microglia at day 0 and in ROI 3 at day 8. For the graphs in a–d, data were normalized to control mean. For a–h, the center line represent the median; box limits the 25th to 75th percentiles, and whiskers the minimum to maximum values. Statistics for a–d, g and h: a, *p=0.033 (n=6 mice each); b, **p=0.004 (n=6 (Ctrl) or 5 (cKO) mice); c, **p=0.0095 (n=4 (Ctrl) or 6 (cKO) mice); d, p=0.63 (n=6 (Ctrl) or 4 (cKO) mice); g,h, ***p=0.0006 (g), p=0.95 (h) (n=32 (sham) or 26 (AMD3100) cells from 6 mice each). Two-sided Mann-Whitney U test. Statistics for e and f, p<0.0001 (e) and p=0.01 (f) for genotype-time interaction, two-way ANOVA (n=9 (day 0 Ctrl, day 3 cKO, day 8 Ctrl, day 28 Ctrl), 5 (day 0 cKO), 11 (day 3 Ctrl), 48 (day 8 cKO) or 6 (day 28 cKO) cells from n=4 mice each). ***p<0.001, **p=0.006 (e), **p=0.006 (f), Sidak’s post-test, p-values are also provided in the Nature Reporting Summary.
