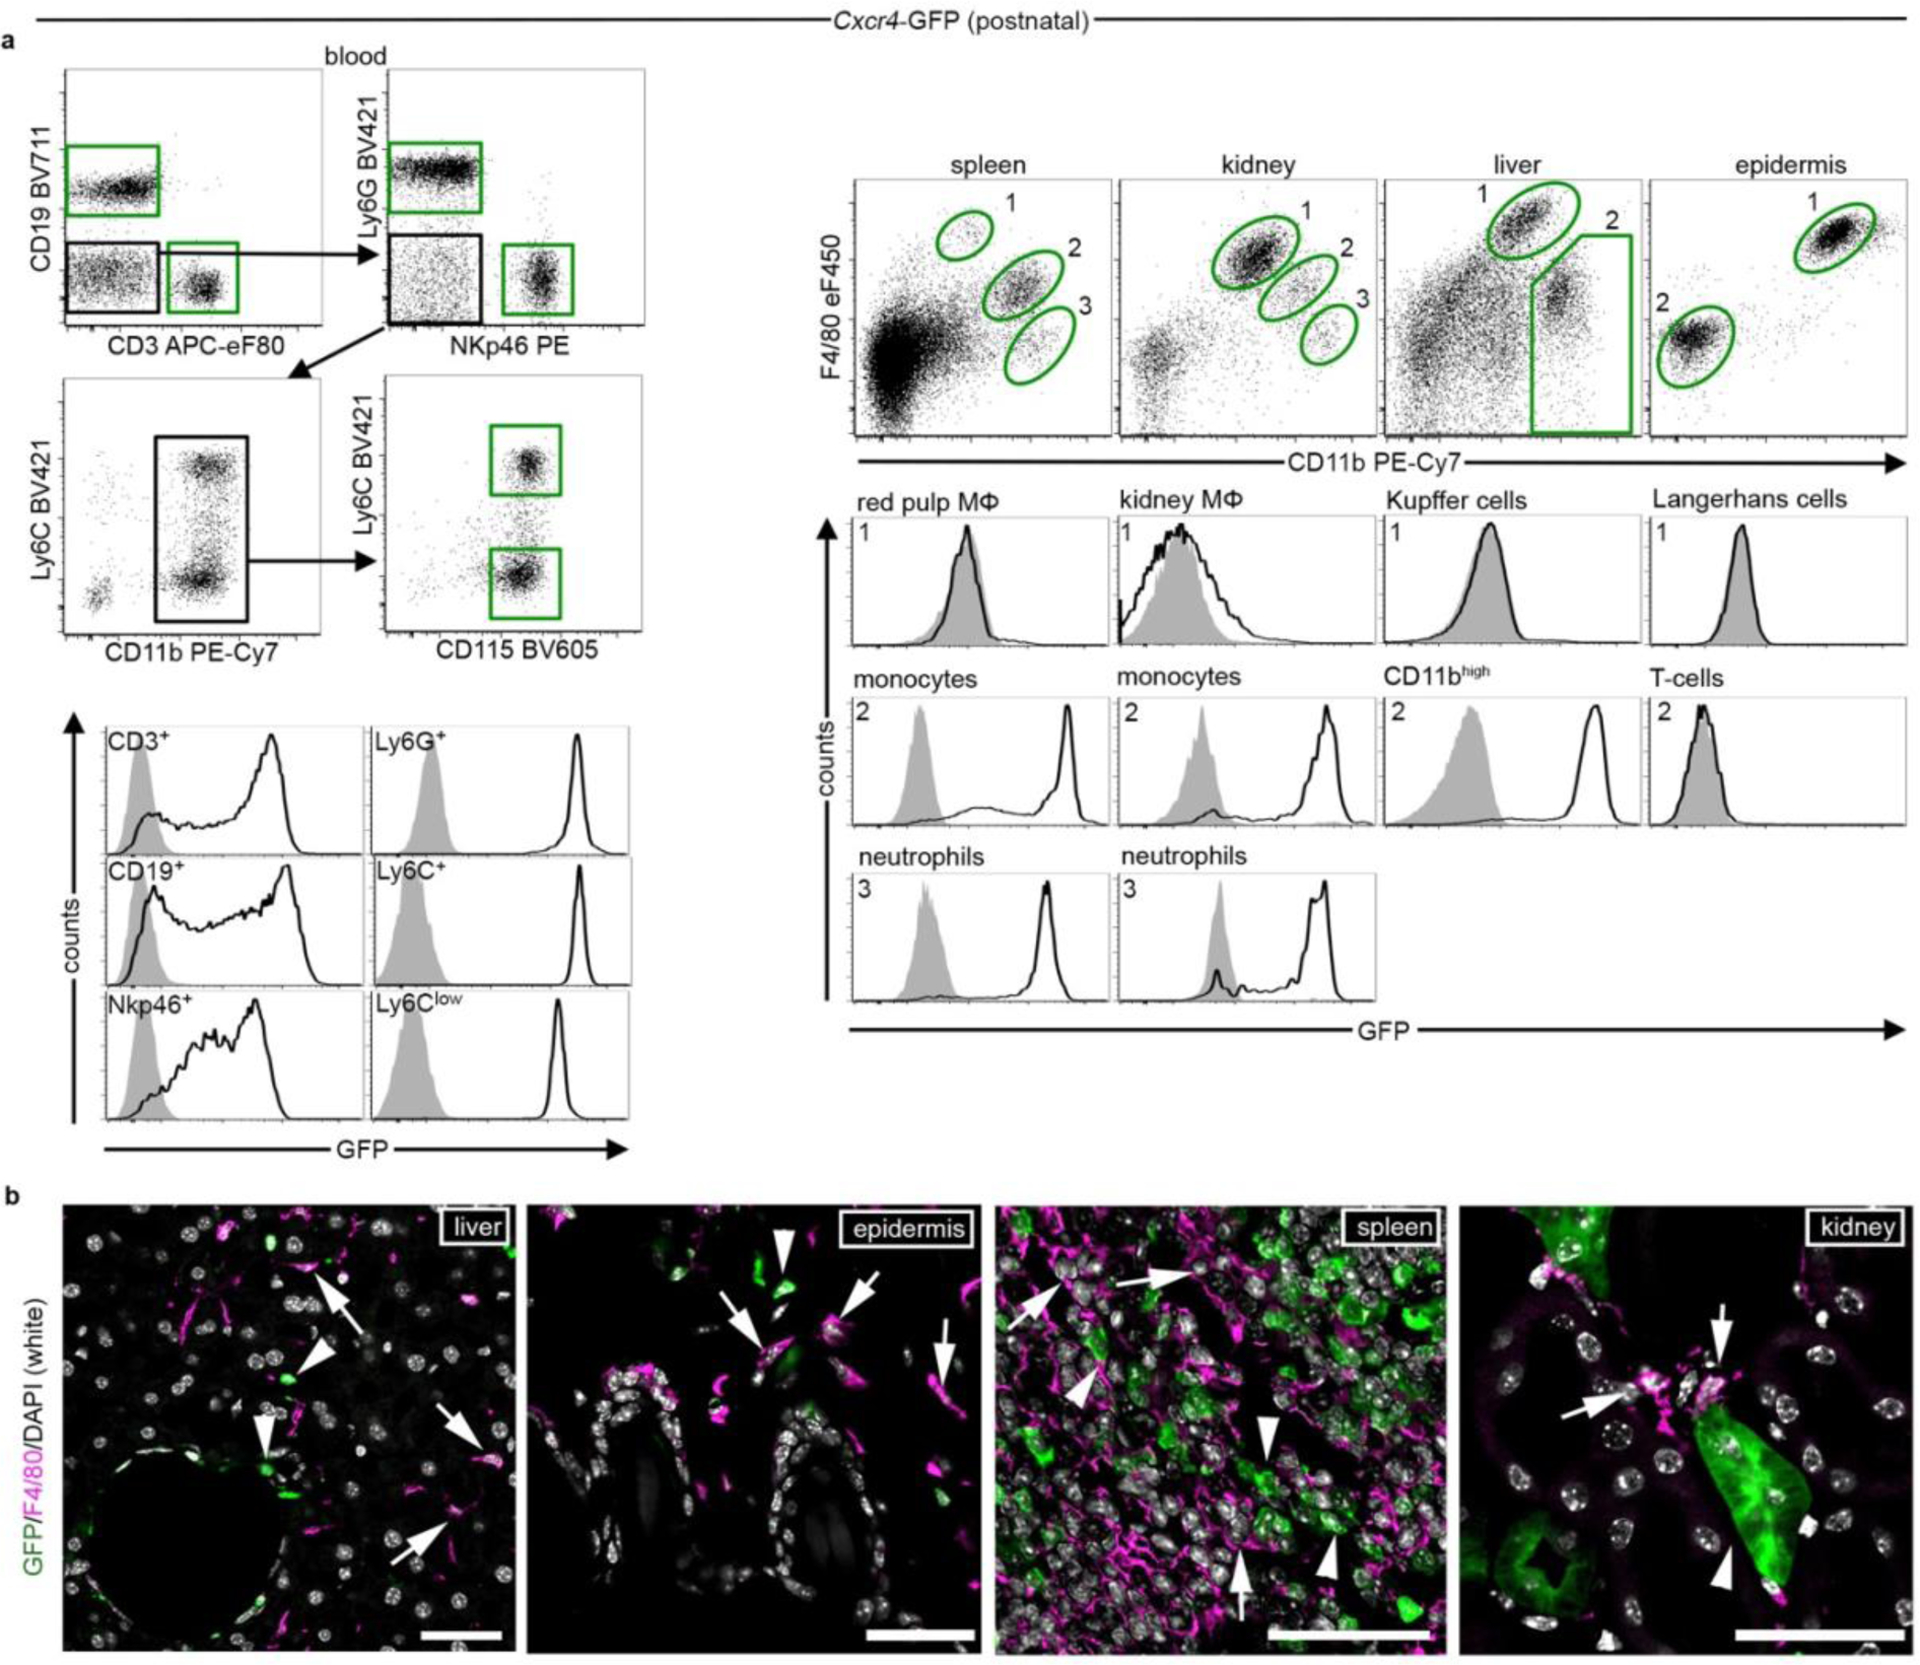
Extended Data Fig. 1:

Analysis of Cxcr4-GFP expression. a, Flow cytometry analysis of GFP signal in postnatal (>P21) Cxcr4-GFP mice (solid line histograms) and wild-type controls (filled histograms). Cells analyzed were blood leukocytes including B-cells (CD19+), T-cells (CD3+), natural killer cells (NKp46+), neutrophils (Ly6G+), Ly6Clow and Ly6Chi monocytes (CD115+ Ly6Clow/Ly6Chi), CD11b+ F4/80high tissue MΦ (gate 1), and CD11bhigh tissue myeloid cells (gates 2 and 3). Data are representative for n=4 (blood), n=7 (spleen, kidney, and liver), and n=6 (epidermis) mice. b, Confocal micrographs of immunofluorescences for GFP (green) and F4/80 (magenta) in the indicated tissues of postnatal Cxcr4-GFP mice (≥P28). Arrowheads point to Cxcr4-GFP+ F4/80− and arrows to Cxcr4-GFP− F4/80+ cells. Representative for n=3 mice each. Scale bars: 45μm (b)
