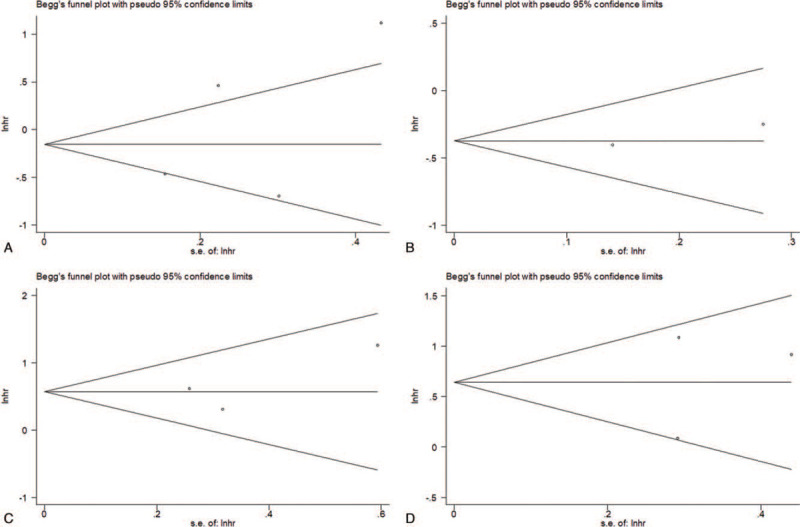
Figure 4.

Publication bias examined by Begg plot test for (A) density of CD68+ TAMs in IT and OS (P = .734); (B) density of CD68+ TAMs in IT and DFS (P = 1); (C) density of CD163+ M2-like TAMs in IT and OS (P = .602); and density of CD163+ M2-like TAMs in IT and DFS (P = 1). CI = confidence interval; DFS = disease-free survival; IT = intratumor; OS = overall survival; TAMs = tumor-associated macrophages.
