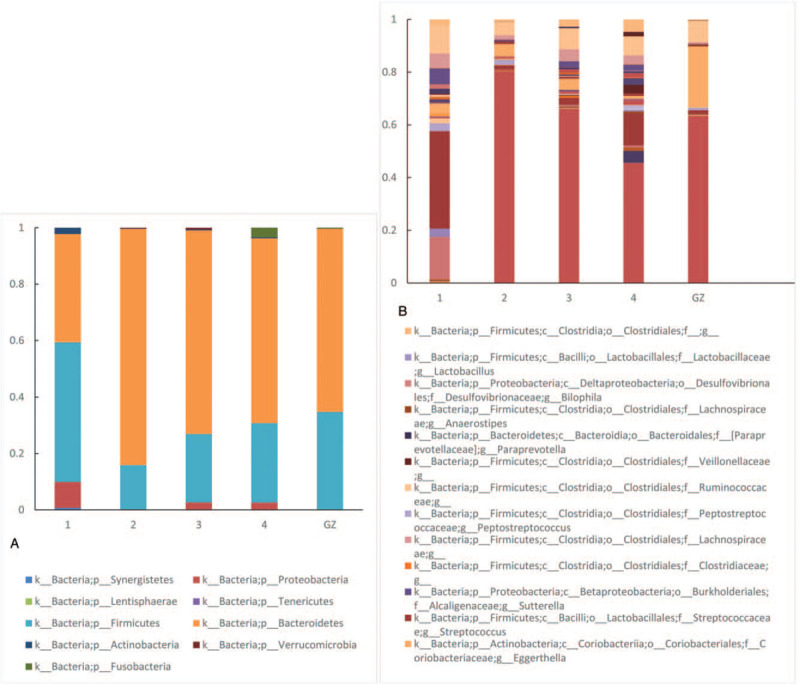
Figure 4.

Distribution of the bacterial flora in the donor group and the patient before and after the faecal microbiota transplantation (FMT) treatment at the phylum and genus levels. 1, before the treatment; 2, 28 days after the first course of FMT; 3, 30 days after the second course of FMT; 4, 70 days after the third course of FMT; GZ, donor. 4a shows the changes in the bacterial flora in the donor group and the patient before and after the FMT treatment at the phylum level, whereas 4b shows the changes at the genus level.
