Figure 4.

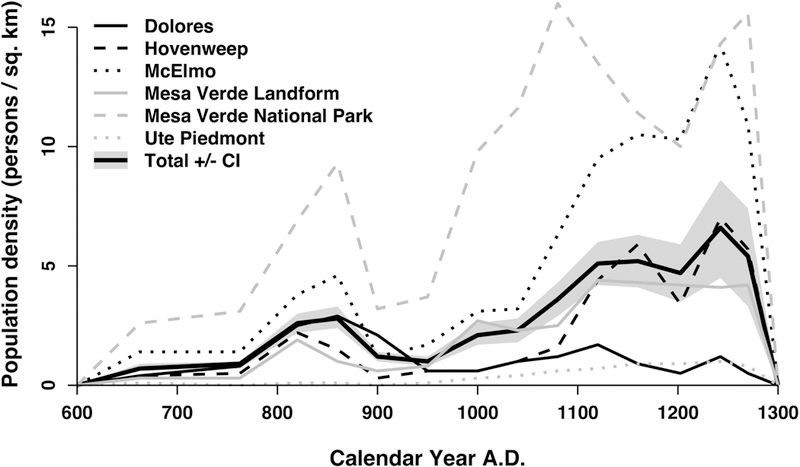
Population density by sampling subregion through time. The average population density for the entire study area is shown as a thick black line bounded with 80% informal confidence intervals in gray.

Population density by sampling subregion through time. The average population density for the entire study area is shown as a thick black line bounded with 80% informal confidence intervals in gray.