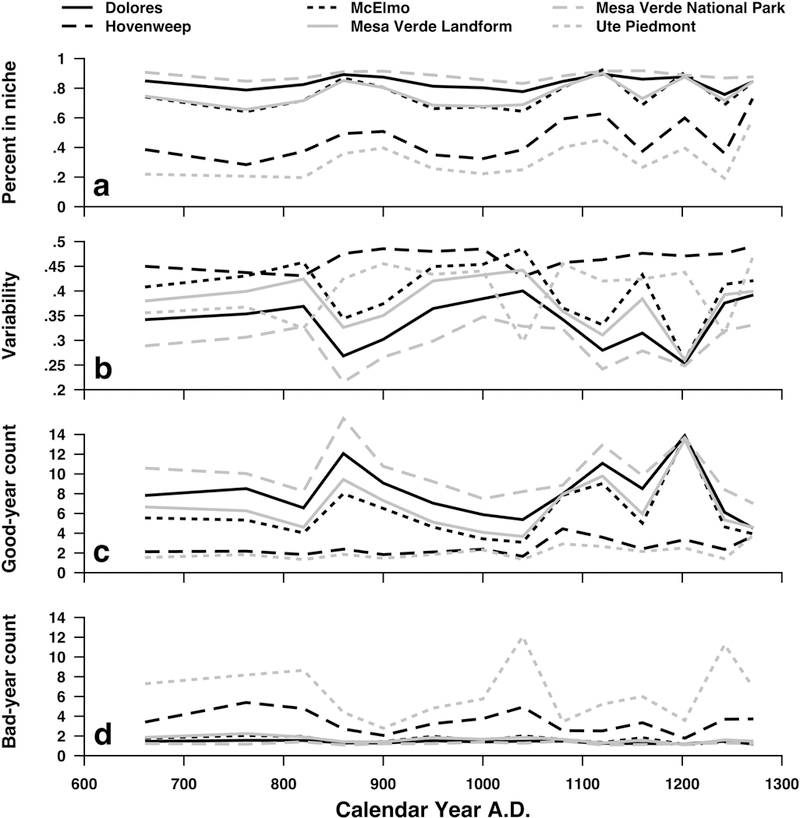
Figure 6.

Niche metrics by subregion and period, shown at period midpoints. a, the percent of landscape in the maize niche; b, the mean standard deviation (“variability”); c, the mean number of consecutive years inside of the niche (“good-year count”); d, the mean number of consecutive years outside of the niche (“bad-year count”).
