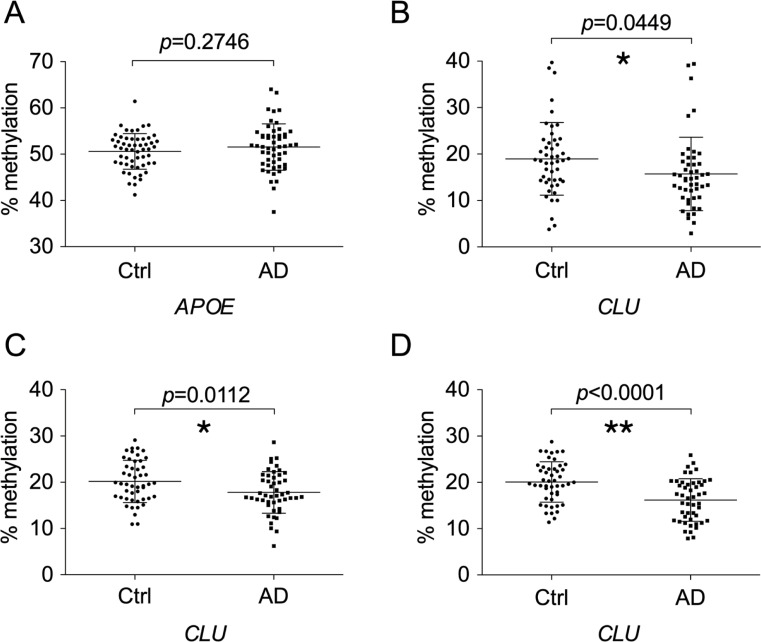
Fig 3. Confirmation of the absence and presence of methylation differences at CpG island shores of APOE and CLU, respectively, between control and AD subjects.
Methylation rates in the replication group were quantified by Sanger sequencing for the CpG island shores of APOE (A) and CLU (B). Pyrosequencing was also employed for CLU to examine methylation differences in the test (C) and replication groups (D). The positions surveyed by Sanger sequencing were the same as those in Fig 2. The position of the genomic region in CLU quantified by pyrosequencing is shown in S2 Fig. Abbreviations: Ctrl, control subjects; AD, Alzheimer’s disease subjects.

