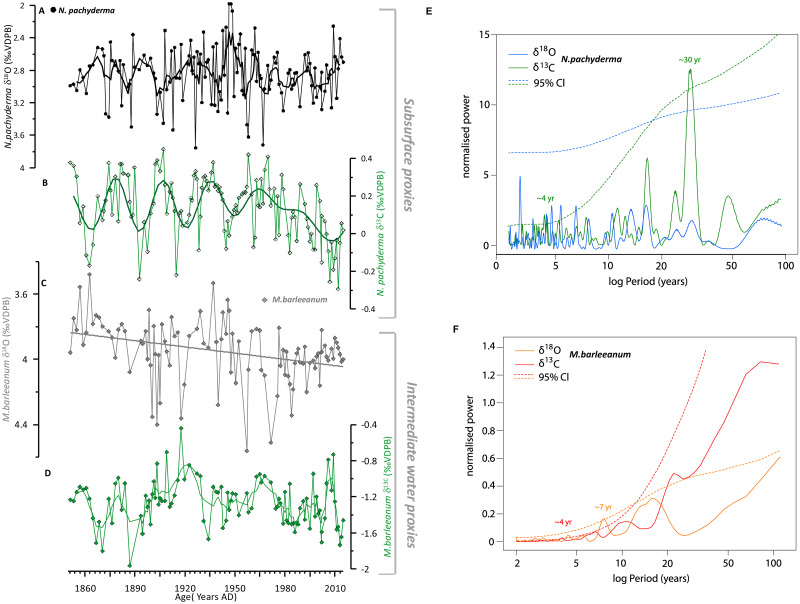
Fig 3. GS15-198 33 marine sediment core climate proxies over the historical time interval.
(A) δ18O time series of N. pachyderma in black and 5 point running mean (thick line) (B) δ13C time series of N. pachyderma in green (raw data) plotted on top the 25-yrs high-pass filter to highlight the significant ~30 cycle identified in the frequency analysis. (C) δ18O time series of M. barleeanum (vital effect corrected) in grey, with the long-term trend highlighted as black linear regression (D) δ13C time series of M. barleeanum in green (raw data) and 5 point running mean as a thick line. Power spectral density functions of isotopic records for E) N.pachyderma and F) M.barleeanum from core GS15-198-33 using the Lomb-Scargle Fourier transform [57]. The spectra of the data are tested against the theoretical red-noise spectrum computed from simulated 20,000 AR1 series. The dashed curves are the estimated red-noise 95% confidence limits for the respective records. Significant periodicities (95% Cl) are also noted.

