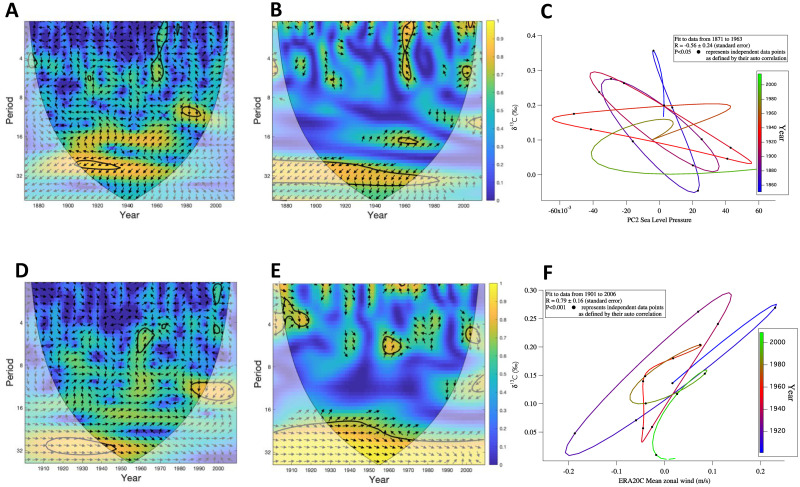
Fig 6. Comparison of stable carbon isotope time series with East Atlantic Pattern (EAP) and local wind forcing on the NIS.
(A) Cross Wavelet Transform (XWT) analysis between δ13C time series of N. pachyderma and PC2 SLP 20CR over the North Atlantic domain: 2nd principal component from 20th Century sea-level pressure data [84], (i.e. the EAP), (B) Wavelet coherence analysis (WTC) between the two time series. The thick black contour designates the 5% significance level against red noise and the cone of influence where edge effects might distort the picture is shown as a lighter shade; the relative phase relationship is shown as arrows (with anti-phase pointing left), (C) Crossplot between the lowpass filtered N. pachyderma δ13C and PC2 SLP time series displaying the anticorrelation between the data; using the Stats Linear Correlation Test from IGOR PRO 6 software. The timeline displays that their antiphase relationship disappears from the 1950s onwards when the Marine Suess effect dominates. (D) Cross Wavelet Transform (XWT) analysis and (E) WTC between δ13C time series of N. pachyderma the surface easterly wind component (Vwind) of ERA-20C data of the 20th century from 1900–2010 [87] for winter months (NDJ) from a narrow 3 by 3-degree grid box (65–68 °N, 19–22 °W) North of Iceland over the core location; the relative phase relationship is shown as arrows (with in-phase pointing right), (F) Crossplot between the bandpass filters of N. pachyderma δ13C and the surface easterly wind component (Vwind) of ERA-20C data of the 20th century.

