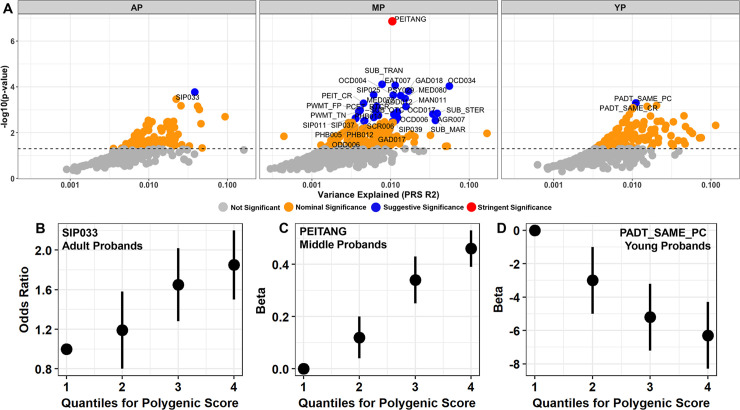
Fig 2. Autism PRS association with PNC phenotypes.
Overview of best-fit models for autism spectrum disorder (ASD) associating with neurodevelopmental phenotypes in adult (AP, Nphenotypes = 324), middle (MP, Nphenotypes = 490), and young (YP, Nphenotypes = 311) probands of the Philadelphia Neurodevelopmental Cohort. (A) Maximum phenotypic variance explained (R2) by the best model fit for each trait given genetic liability to ASD. The dashed horizontal line represents the nominal significance threshold. (B-D) The relationship between binned ASD polygenic risk scores for AP, MP, and YP participants and the most significant phenotype predicted by ASD genetic liability: (B) SIP033 Structural Interview for Prodromal Symptoms: “Has anyone pointed out to you that you are less emotional or connected to people than you used to be?”; (C) PEITANG: Number of correct responses to anger trials during completion of The Penn Emotional Identification Test (PEIT) for recognizing angry emotions; (D) PADT_SAME_PC: Percent of correct responses to test trials with no age difference during completion of the Penn Age Differentiation Test for detecting which face in a face pair appears older. Note the lowest quartile in figures B-D represents the referent.

