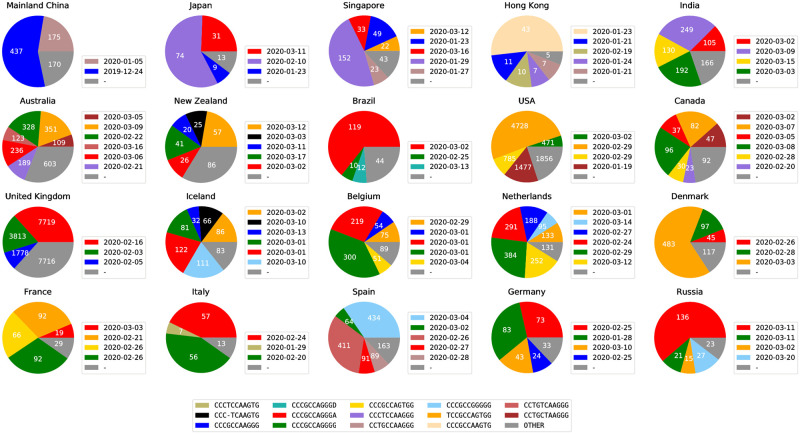
Fig 5. Major subtypes in countries/regions with the most sequences (in the legend next to each country/region, we show the date when a major subtype was first sequenced in that country/region).
Subtypes with less than 5% abundance are plotted as “OTHER”. The raw counts for all ISMs in each country/region, as well as the date each ISM was first found in a sequence in that country/region, are provided in S5 File.

