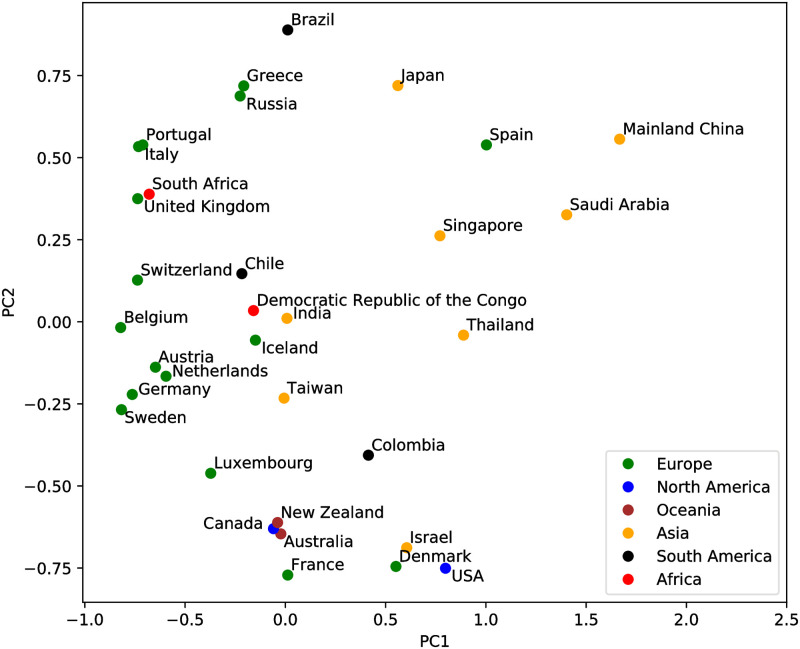
Fig 7. Country/Region-specific patterns of viral genetic variation visualized by the first two principle components of the Bray-Curtis dissimilarity matrix.
The regions are color coded by continents. Each point represents the SARS-CoV-2 genetic variation pattern of the labeled country/region based on the abundance of different ISMs in the country/region.

