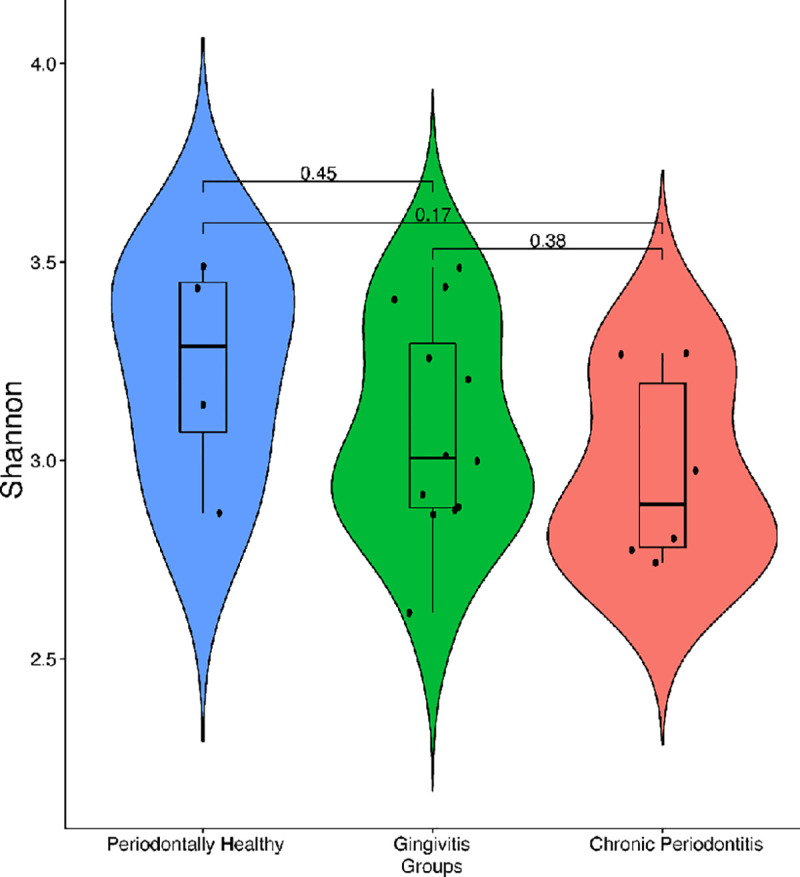
Fig 3. Taxonomic diversity of bacterial communities in healthy and diseased samples.

Violin plots show the distribution and density of oral bacteria across three groups of patients. Overall, 22 samples were analyzed being 4 (18.2%) retrieved from healthy patients, 12 (54.5%) from those with gingivitis, and 6 (27.3%) from those with chronic periodontitis. Alpha diversity was measured using the Shannon index (Y-axis). The boxes represent the interquartile range (IQR) between the first and third quartiles (25th and 75th percentiles, respectively). The vertical line inside the box defines the median. Whiskers represent the upper and lower adjacent values. P-values of comparisons are displayed above each block analyzed.
