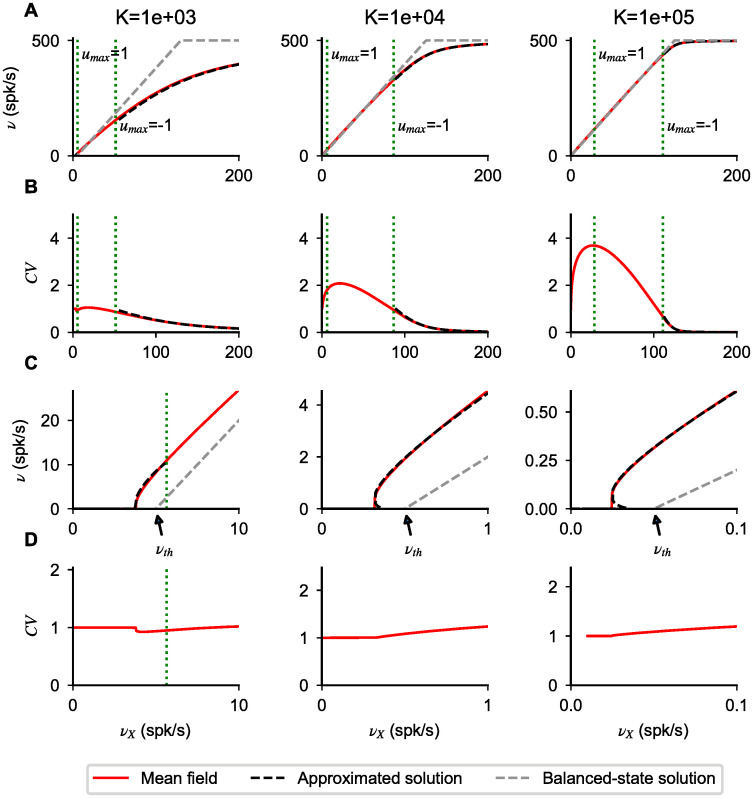
Fig 2. Types of nonlinearities in network response.
(A) Network transfer function obtained solving numerically Eqs (3)–(5) for different values of K (indicated on top of each column). (B) CV of interspike interval distribution obtained solving numerically Eq (6) (red lines). (C,D) Plots as in A, B but zoomed in the region of response onset. In all panels, dotted green lines correspond to the values at which umax = 1 and umax = − 1, i.e. they indicate the separation between the different operating regimes mentioned in the main text. Firing nonlinearities at response onset and saturation are captured by approximated forms (black dashed lines) obtained for umax ≪ − 1 (Eq (13)) and umax ≫ 1 (Eq (15)), respectively. For umax ∼ 0, the transfer function approaches the balanced-state solution (gray dashed lines, Eq (17)); in the region − 1 < umax < 1, the first order corrections are of order and become negligible as K increases. In the suprathreshold regime (umax ≪ − 1), the CV approaches zero, i.e. firing becomes regular, with a decay with input strength captured by Eq 14 (dashed line). Parameters: J = 0.2 mV, g = 5.0, gX = 1.

