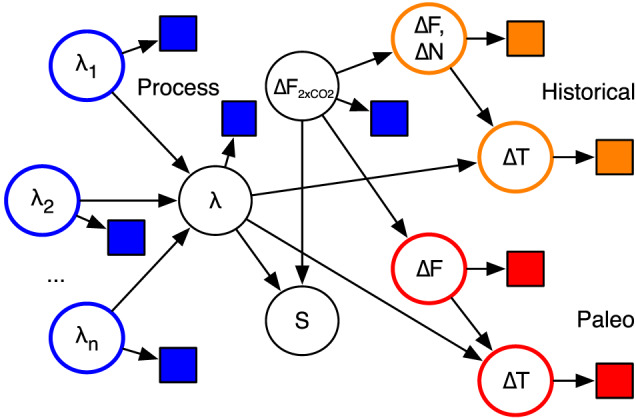
Figure 2.

A Bayesian network diagram showing the dependence relationships between main variables in the inference model. Circles show uncertain variables, whose PDFs are estimated; squares show evidence (random effects on the evidence would appear as a second “parent” variable for each square and are omitted for simplicity). Colors distinguish the three main lines of evidence and associated variables (blue = process, orange = historical, and red = paleoclimate). For paleoclimate, only one ∆F/∆T climate change pair is shown but two independent ones are considered (see section 5).
