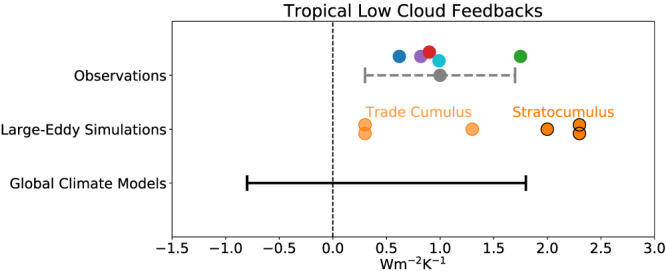
Figure 6.

Local tropical low‐cloud feedbacks from observations, large‐eddy simulations, and global climate models from Klein et al. (2017). Each dot represents the feedback from an individual research study. The upper horizontal bar indicates the central estimate and 90% confidence interval for the feedback inferred in that study from the observations. The lower bar indicates the range of feedbacks simulated by global climate models. Note that our assessment reinterprets the upper horizontal bar into a likelihood statement assuming a uniform prior and with considering additional evidence (section 3.3.2).
