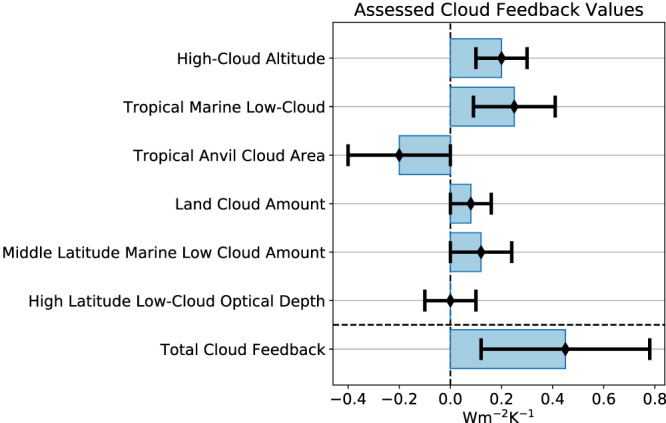
Figure 7.

Assessed values of individual cloud feedbacks and the total cloud feedback based upon process evidence. For individual cloud feedbacks, maximum likelihood values are shown by black diamonds and the widths of blue rectangles, with 2 times the 1‐sigma likelihood values shown by the width of the black uncertainty bars. For the total cloud feedback, the mean value of the PDF is shown by a black diamond and the width of the accompanying blue rectangle, with 2 times the PDF standard deviation shown by the width of the black uncertainty bar.
