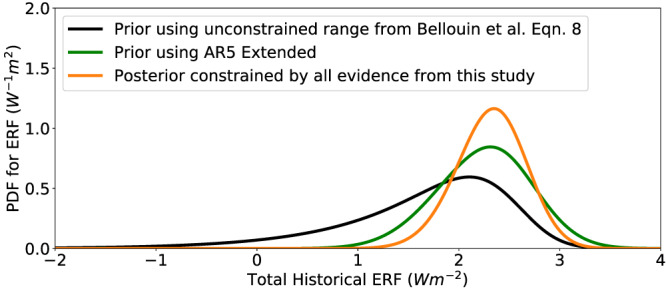
Figure 10.

Prior and posterior PDFs of total (anthropogenic plus natural) ΔF (W m−2), comparing the 2006–2018 period with the 1861–1880 period. The black curve shows the prior forcing used in the Baseline calculation, which uses the unconstrained aerosol forcing based on Equation (8) from Bellouin et al. (2020). The green curve shows the extended AR5 aerosol forcing. The orange curve shows the posterior PDF produced when all prior PDFs are updated by all evidence used in the full Baseline calculation (see section 7), including process, historical, and paleoclimate evidence.
