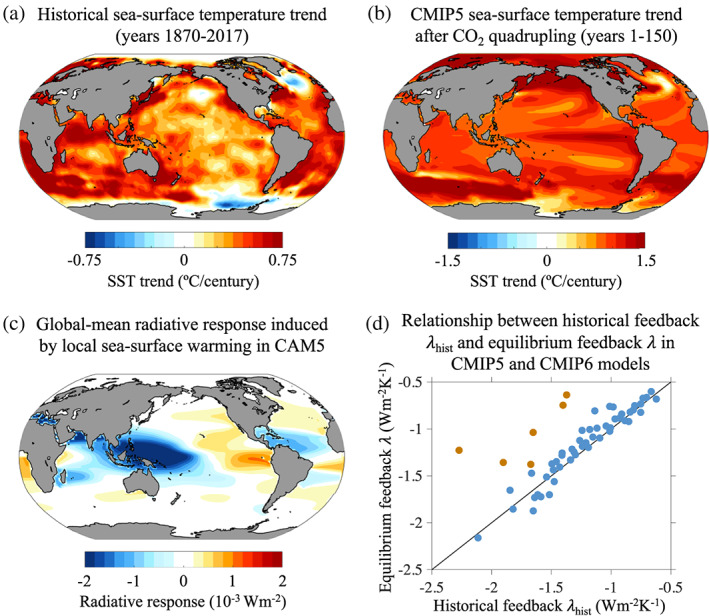
Figure 13.

Illustration of the pattern effect. (a) Linear trend in observed sea surface temperatures (SSTs) over years 1870–2017 from the AMIP2 data set (Hurrell et al., 2008). (b) Linear trend in CMIP5 mean SSTs over 150 years following abrupt CO2 quadrupling. (c) Global mean TOA radiative response induced by perturbing SSTs in one region at a time, calculated as anomalous TOA radiative fluxes in response to local SST perturbations in NCAR's Community Atmosphere Model Version 5 (CAM5) (Zhou et al., 2017; see also Dong et al., 2019, for comparison to CAM4). (d) Relationship between historical feedbacks λ hist and the long‐term λ in coupled CMIP5 and CMIP6 models using values from analysis in Lewis and Curry (2018) and Dong et al. (2020) (blue points), respectively, and for atmosphere‐only simulations from Andrews et al. (2018) (orange points).
