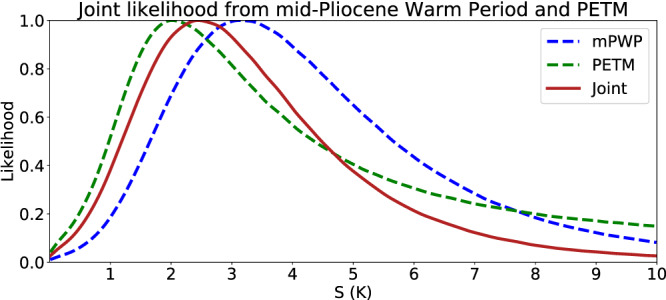
Figure 18.

Analysis of mPWP and PETM results. Blue and green dashed lines are mPWP and PETM results as previously shown. Red line is joint likelihood obtained accounting for dependency as described in the text. As explained in section 5.3.2, the mPWP result is our proposed result.
