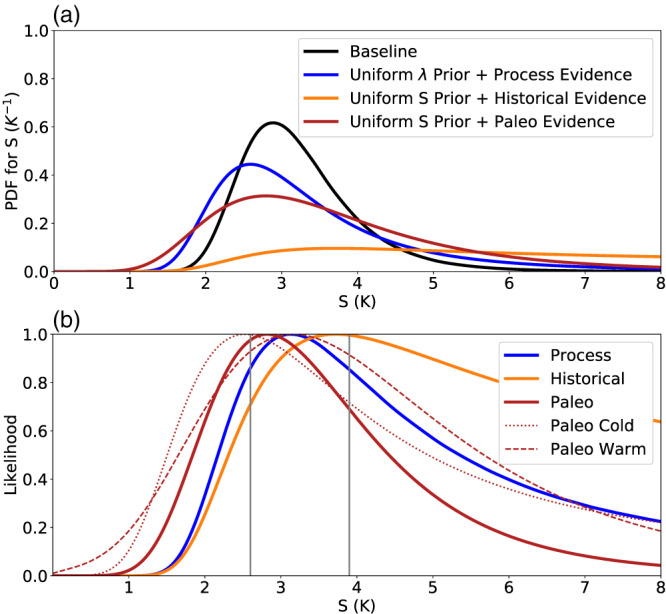
Figure 20.

Posterior PDF for S and comparison of lines of evidence. Panel (a) shows our Baseline posterior PDF for S in black and PDFs for each main line of evidence individually, where the process evidence is combined with a uniform λ prior, while the others are combined with a uniform prior on S. Panel (b) shows marginal likelihoods for S for the various lines of evidence used in the Baseline calculation: the individual‐feedback process evidence (section 3), the likelihood from historical evidence (section 4), and the likelihoods for past warm and cold climates from paleoclimate evidence plus their combined likelihood (section 5). All likelihoods are scaled to have a maximum value of unity. Vertical gray lines show the 66% range for the Baseline posterior for S.
