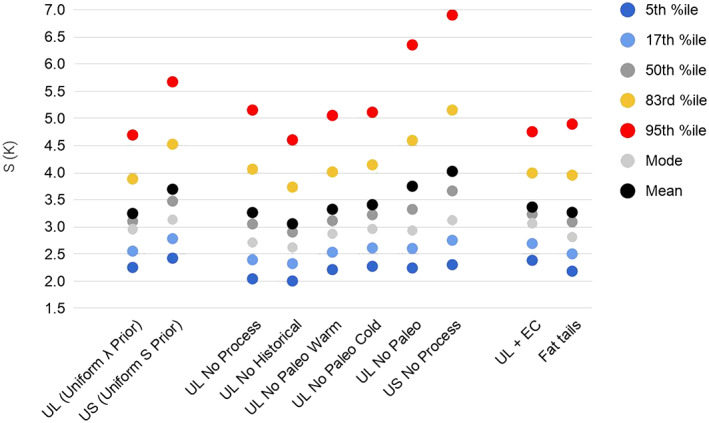
Figure 22.

Graphical summary of statistics of posterior PDFs for S. UL is the Baseline calculation with a uniform prior on λ and US has a uniform prior on S. The middle group shows the effect of removing various lines of evidence in turn. UL + EC shows the impact of including the effect of emergent constraints. The effect of substituting fat‐tailed distributions for some lines of evidence is also shown for the Baseline case.
