Figure 1.

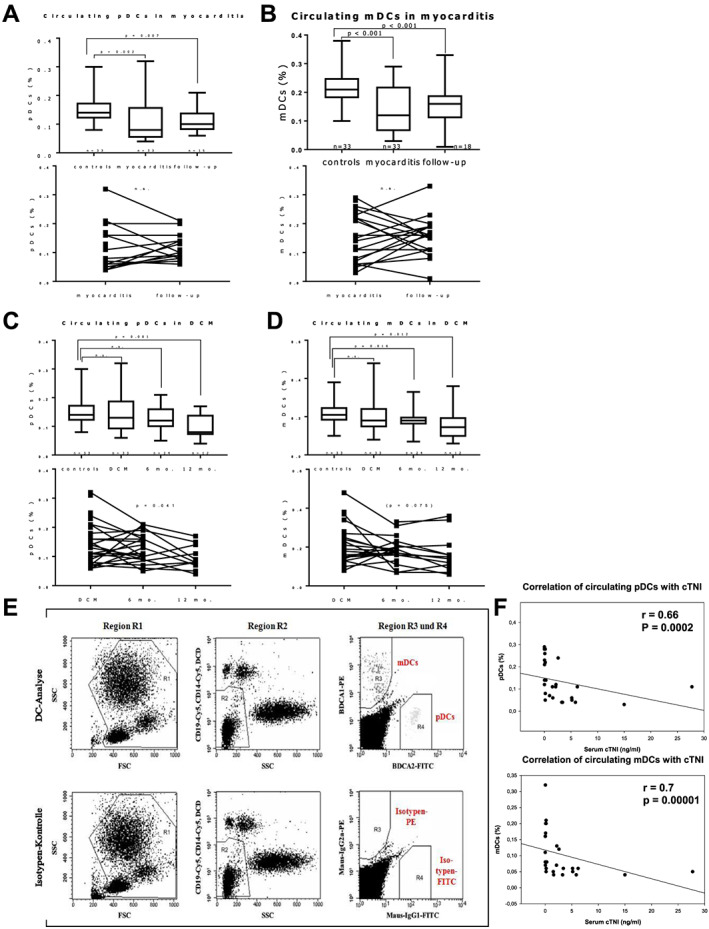
Flow cytometry analysis of circulating plasmacytoid (p) and myeloid (m) dendritic cells (DCs), as percentage of total white blood cells. (A–D) Boxplots showing relative circulating m and pDCs at baseline and follow‐up compared with controls; P‐values indicate significant difference to controls (Mann–Whitney U test); error bars indicate minimal and maximal values. Both DC subsets are reduced in myocarditis at baseline compared with controls (A and B). In patients with dilated cardiomyopathy (DCM), circulating DCs are reduced gradually during the course of the disease, reaching statistical significance after 6 or 12 months (C, D). Individual longitudinal (paired) patient data of myocarditis and DCM at baseline and follow‐up are shown in the respective graphs below. P values in longitudinal DCM data indicate significance (or near significance) in non‐parametric variance analysis (Friedman test). (E) Typical gating strategy for flow cytometry analysis of circulating DCs. (F) Circulating DCs correlate with serum cardiac Troponin I (cTNI) in myocarditis patients (Spearman rank order test).
