
Figure 3.
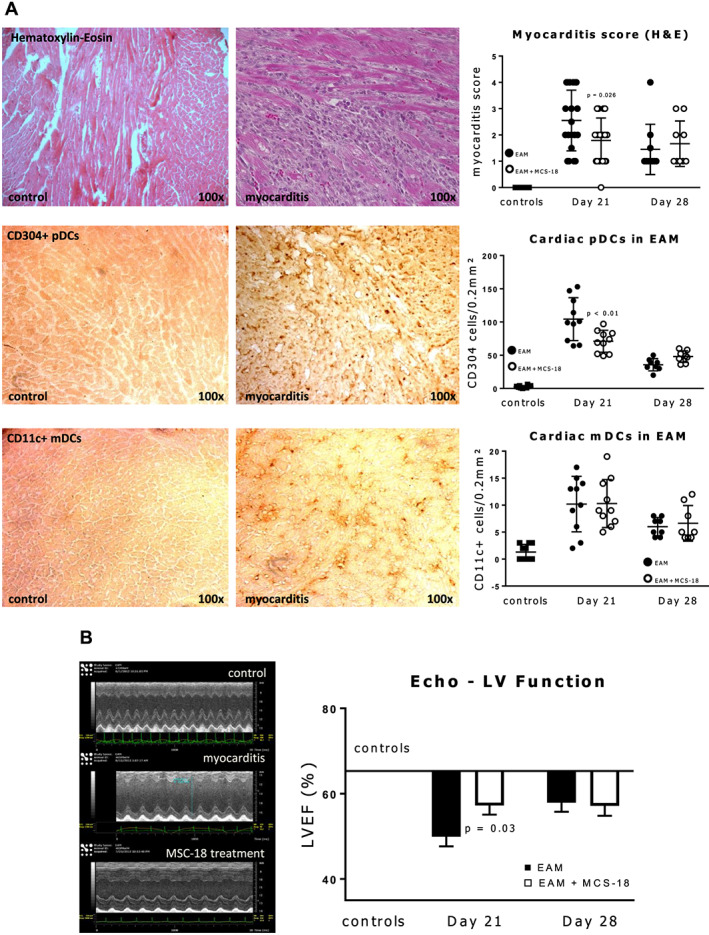
(A) Haematoxylin and eosin (H&E) and immunohistochemistry staining with antibodies for the two subtypes of dendritic cells (DCs) of myocarditis mouse heart sections showing massive T cell infiltration and accumulation of plasmacytoid (p) and myeloid (m) dendritic cells (DCs) in myocarditis compared to controls. Scatter plots on the right show myocarditis scores for H&E sections and numbers of stained DCs at peak of inflammation (Day 21) and at recovery phase (Day 28). T‐cell inflammation and infiltration with pDC (but not mDC) at the acute phase is milder in animals treated with MCS‐18. Scattered plots indicate individual values, as well as mean and standard deviations. P values indicate significant differences (Student's t‐test) between MSC‐18 treated and untreated groups. See Methods section for a full description of the myocarditis score. Used antibodies for pDCs: CD304, Neuropilin‐1; for mDCs: CD11c, Integrin α‐X. (B) Left: typical M‐mode mouse echocardiography showing dilation and reduced ejection fraction of the left ventricle (LVEF) in experimental autoimmune myocarditis (EAM) compared with controls; right: graphic representation of LVEF reduction in EAM mice with and without MCS‐18 treatment. Horizontal bar shows mean LVEF of control mice. MCS‐18 treatment ameliorates EF reduction in peak myocarditis at Day 21 but not at recovery (Day 28). P value indicates significant difference between treated and untreated mice (Student's t‐test).