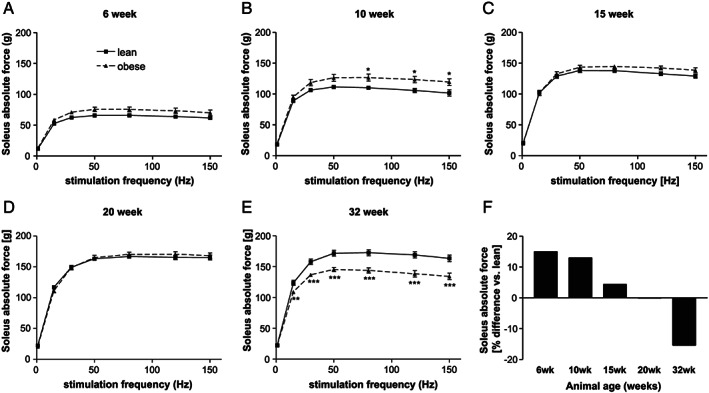
FIGURE 3.

Soleus absolute force generation of ZSF1‐lean (square, solid line) and ZSF1‐obese (triangle, dashed line) rats at 6 (A), 10 (B), 15 (C), 20 (D), and 32 (E) weeks of age. The % difference in maximal absolute force between ZSF1‐lean and obese animals was calculated for the different age groups. Values are shown as mean ± SEM. * P < 0.05, ** P < 0.01, *** P < 0.001 vs. ZSF1‐lean.
