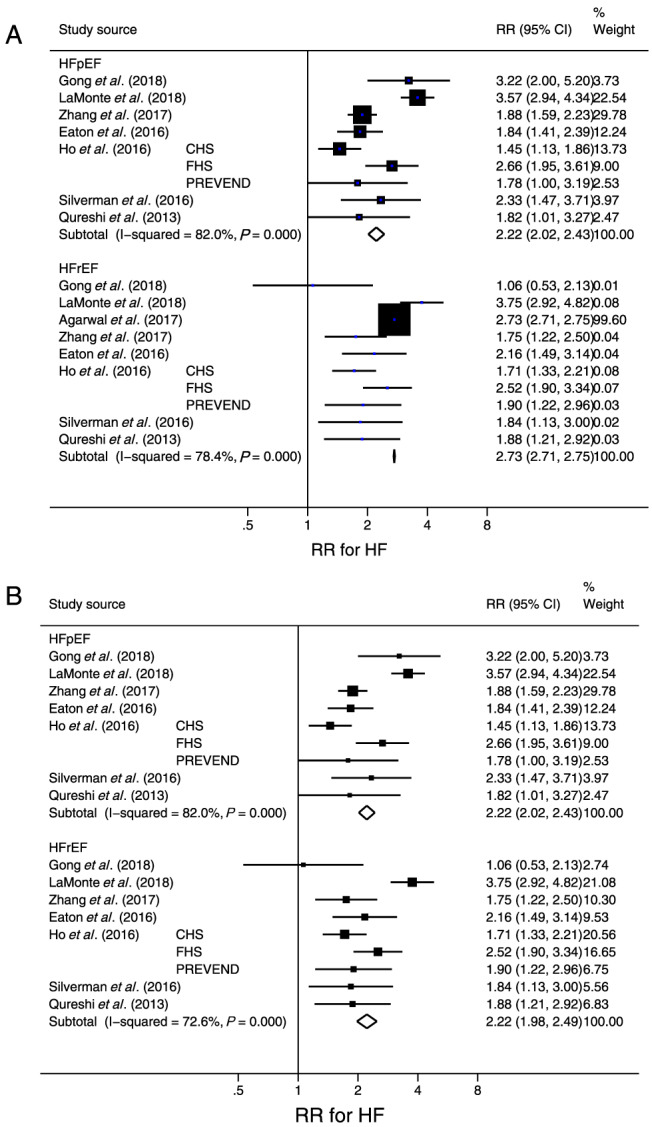
Figure 2.

(A) Forest plot of the risk ratio (RR) for new‐onset heart failure with preserved ejection fraction (HFpEF) and heart failure with reduced ejection fraction (HFrEF) in participants with diabetes mellitus compared with those without diabetes mellitus. (B) The forest plot after excluding one study (Agarwal et al.) with an extremely large study weight (i.e. inverse of square of standard error of the RR). The RR in each study is indicated by a square. The area of squares is proportional to the study weight. The pooled RR is indicated by a diamond. Abbreviations: CHS, Cardiovascular Health Survey; FHS, Framingham Health Study; Prevention of Renal and Vascular End‐Stage Disease.
