
Figure 3.
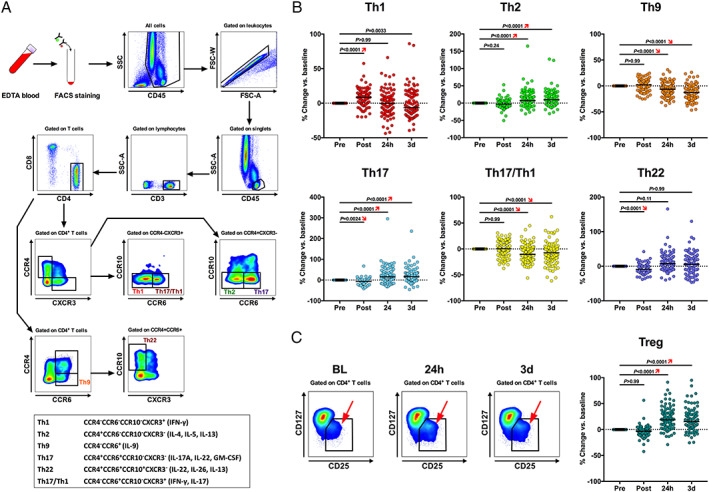
Intraindividual time courses in circulating CD4+ T‐cell subset counts. (A) CD4+ effector T‐cell subset flow gating strategy and immunophenotyped legend (box). (B) Kinetics of CD4+ effector T‐cell counts including Th1, Th2, Th9, TH17, Th17/Th1, and Th22 cells. (C) Gating strategy and representative flow plots showing changes in CD4+ T regulatory cells after transcatheter aortic valve implantation (TAVI). (D) Kinetics of Treg counts following TAVI. Subset counts are shown as percentage change (median) during the prespecified time points after TAVI, with the baseline value (pre‐TAVI) set to 0% (Friedman test, with Dunn's multiple‐comparisons test).