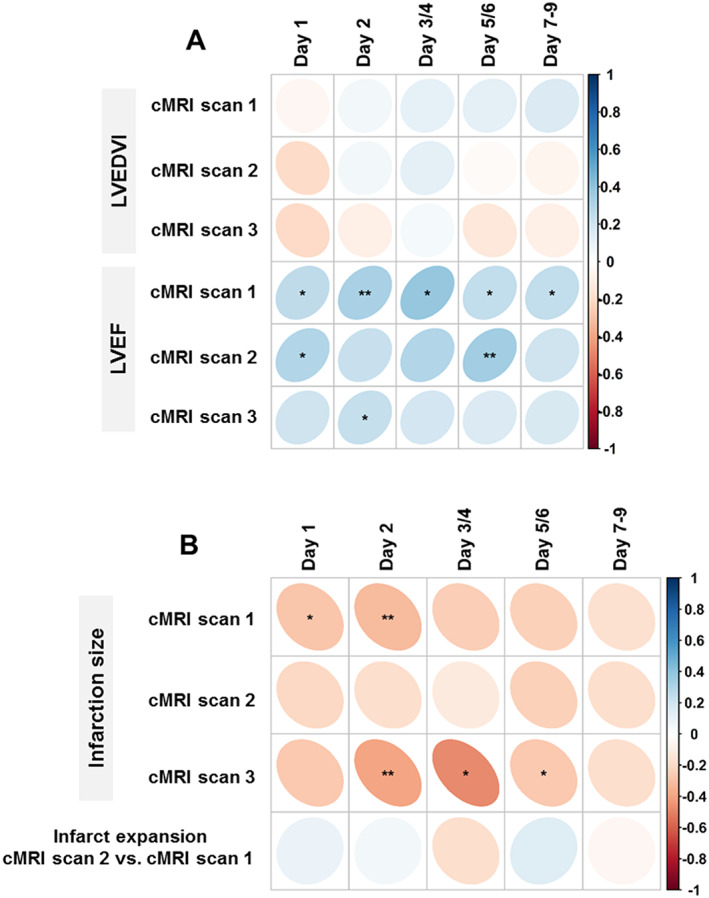
Figure 3.

Relation of FXIIIa levels with indices of cardiac remodelling. Spearman correlation between FXIIIa levels measured within the first 7 to 9 days after myocardial infarction and repetitively measured cardiac MRI parameters. (A) Strength of correlation with LVEDVi and LVEF at baseline (i.e. within the first 96 h after MI; cMRI Scan 1), after 7–9 days (Scan 2), and after 12 months (Scan 3). (B) Strength of correlation with rIS at baseline (i.e. within the first 96 h after MI; cMRI Scan 1), after 7–9 days (Scan 2), and after 12 months (Scan 3); and with infarct expansion represented by the difference in rIS between Scan 2 and Scan 1. The colour represents the correlation coefficient, with bluish colours for positive and reddish colours for negative correlations. The area of the individual dot represents the number of patients in each separate analysis. LVEDVi, left ventricular end‐diastolic volume indexed to body surface area; LVEF, left ventricular ejection fraction; rIS, relative infarct size. * indicates P < 0.05, and ** P < 0.01.
