
Figure 1.
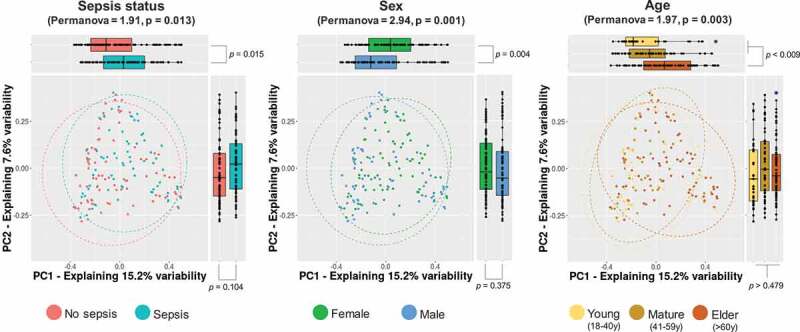
Microbial community structure of the study groups. Principal coordinate analysis (PCoA) of multidimensional data is drawn to display changes in microbial communities according to major variables retrieved to shape the IM, sepsis status, sex, and age. The x- and y-axes represent the two most informative principal coordinates (PCs) of the PCoA, and marginal boxplots describe the distribution of those values for the different groups. Color legends represent the respective variables under analysis. Blue-shaded points show outliers. A pairwise Wilcoxon rank-sum test was used to compare PC1 or PC2 values between groups, and p-values are shown beside marginal boxplots. The results of the permutation-based test (PERMANOVA) to compare dissimilarity indexes among samples are shown on top of plots accordingly.