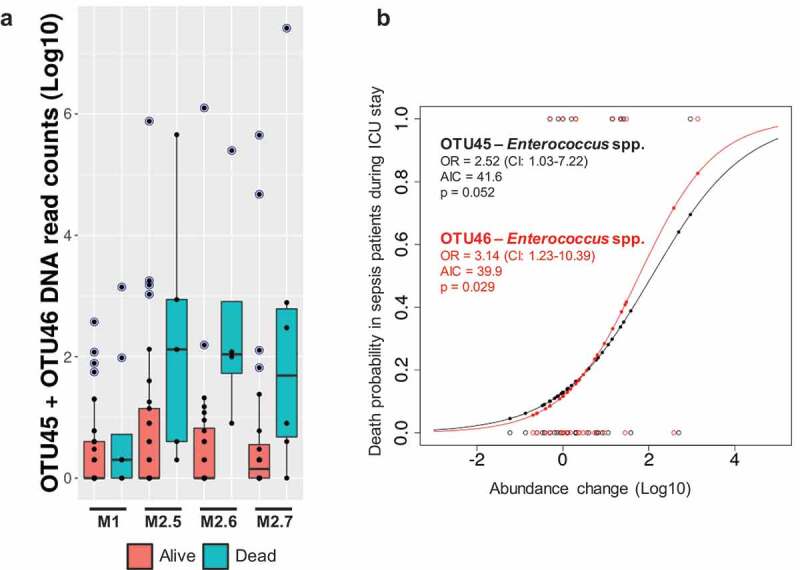
Figure 4.

OTUs associated with death. A – The normalized DNA read counts (log10) for OTU45 and OTU46 are depicted in a boxplot manner for sepsis samples across the time (M1 to M2.7) of stay in the ICU. The color legend discriminates the samples from patients with ICU discharge as “alive” and “dead”. Blue-shaded points indicate outliers. B – A logistic regression with data regarding OTUs potentially related to death of ICU patients with sepsis, based on their abundance changes across the ICU stay. Abundance changes were calculated as log[average(M2 samples)] – log[M1 samples]. The OTU information and the associated taxonomy as well as main parameters retrieved after logistic regression, such as the odds ratio (OR), Akaike information criterion (AIC), and p-values, are shown inside the plot.
