
Figure 3.
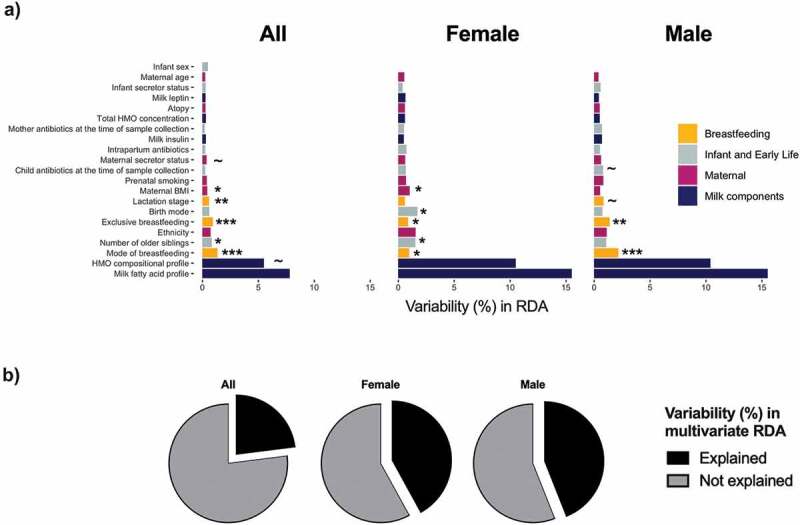
Redundancy analysis of associations of maternal and infant factors with overall milk microbiota composition among 393 dyads in the CHILD cohort. a) Univariate analysis for all infants and stratified by infant sex. b) Cumulative amount explained by all the factors in multivariate analysis. Redundancy values (R2) indicate the % variation explained by each individual factor or each multivariable model. The unexplained variability was calculated by subtracting redundancy value from 100%. BMI, body mass index; HMO, human milk oligosaccharide. P value ~ <0.10, * <0.05, ** <0.01, *** <0.001. Figures are adapted from results originally reported in Moossavi et al.6.