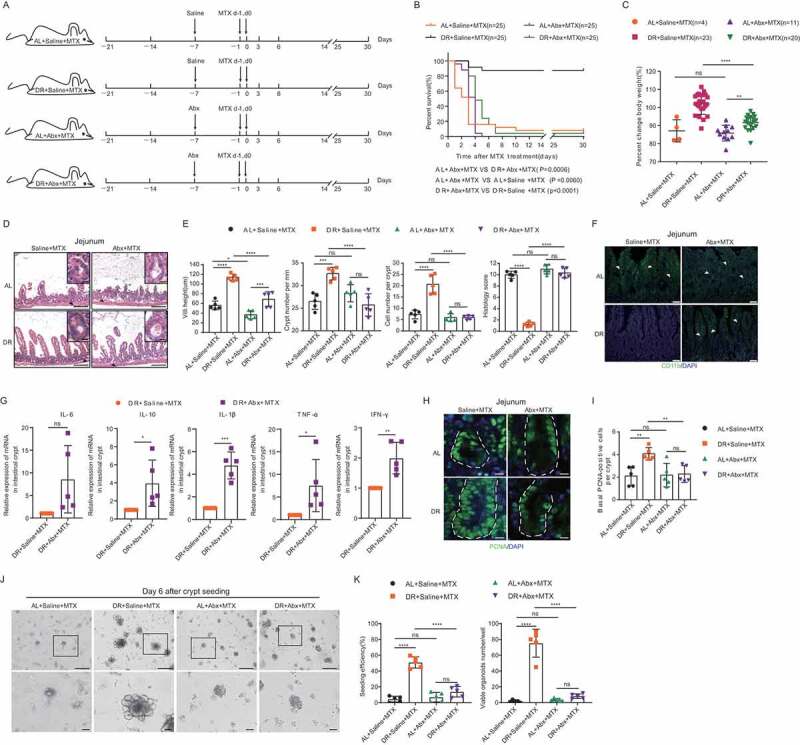
Figure 4.

Ablating the gut microbiota eliminates the protective effect of DR. (A) Scheme of experiments. Two-month-old mice were fed with AL diet or 30% DR diet for 14 days before MTX administration and the diet regimen was continued afterward. Then, all mice were intraperitoneally injected with MTX for 2 days at a dose of 120mg/kg (d-1) and 60mg/kg (d0). Seven days prior to MTX administration, mice were fed by gavage for 5 days and then in drinking water for the following days with broad-spectrum antibiotics or saline. (B) Survival was monitored daily after MTX administration. Number of mice in each group was indicated. Gehan-Breslow-Wilcoxon test (n = 25 mice per group, combined from 2 independent experiments). (C) Percent change of body weight on day 3 after MTX treatment compared to before MTX treatment (number of mice of each group were indicated, results were from 2 combined independent experiments). Note that antibiotics treatment resulted in impaired body weight maintenance of DR mice. (D) Representative images of H&E staining of jejunum on day 3 after MTX administration. Representative crypts are shown in insets. Note that crypts of DR mice were relatively intact while they were destroyed in antibiotics treated mice after MTX administration. Scale bar: 50μm (outside), 20μm (insets). (E) Villi height (45 crypts were counted for each mouse, n = 5 mice per group randomly picked from 2 independent experiments), crypt number per millimeter (crypt number in 15 mm length as a unit was counted, and15 units were counted for each mouse, n = 5 mice per group randomly picked from 2 independent experiments), cell number per crypt (30 crypts were counted for each mouse, n = 5 mice per group randomly picked from 2 independent experiments) from the jejunum on day 3 after MTX administration were shown. Histology score was based on H&E staining (30 vision fields were counted per mouse, n = 5 mice per group randomly picked from 2 independent experiments) from the whole small intestine on day 3 after MTX administration. (F) Representative images of CD11b+ immunofluorescent staining of jejunum on day 3 after MTX administration. Arrow heads point to CD11b+ cells. Note antibiotics treatment induced the extensive infiltration of CD11b+ cells in DR mice after MTX administration. Scale bars: 20 μm. (G) Relative expression of indicated genes in freshly isolated crypt cells from whole small intestine of mice on day 3 after MTX administration by qRT-PCR analysis (n = 5 mice per group randomly picked from 2 independent experiments). Note that antibiotics treatment significantly induced expression of inflammatory genes. (H) Representative images of immunofluorescent staining of PCNA of jejunum on day 3 after MTX treatment. (I) Basal crypt PCNA-positive cell number per crypt on day 3 after MTX administration of the whole small intestine (40 crypts were counted for each mouse, and n = 5 mice per group randomly picked from 2 independent experiments). (J) Representative images of cultured crypts on day 6 in culture derived from mice on day 3 after indicated treatment. Lower line: zoomed in vision of images in square frames of the upper line, note that antibiotics treatment diminished the protective effect in DR mice. Scale bars: 100 μm (upper); 50 μm (lower). (K) Seeding efficiency of cultured crypts on day 3 and number of viable organoids of cultured crypts on day 6 (n = 5 mice per group randomly picked from 2 independent experiments). Results were displayed as mean±SD. n.s; nonsignificant; *: P < .05; **: P < .01; ***: P < .001; ****: P < .0001 by one-way ANOVA. AL+Saline+MTX: mice on AL diet and received MTX injection and saline administration; DR+Saline+MTX: mice on DR diet and received MTX injection and saline administration; AL+Abx+MTX: mice on AL diet and received MTX injection and Abx administration; DR+Abx+MTX: mice on DR diet and received MTX injection and Abx administration.
