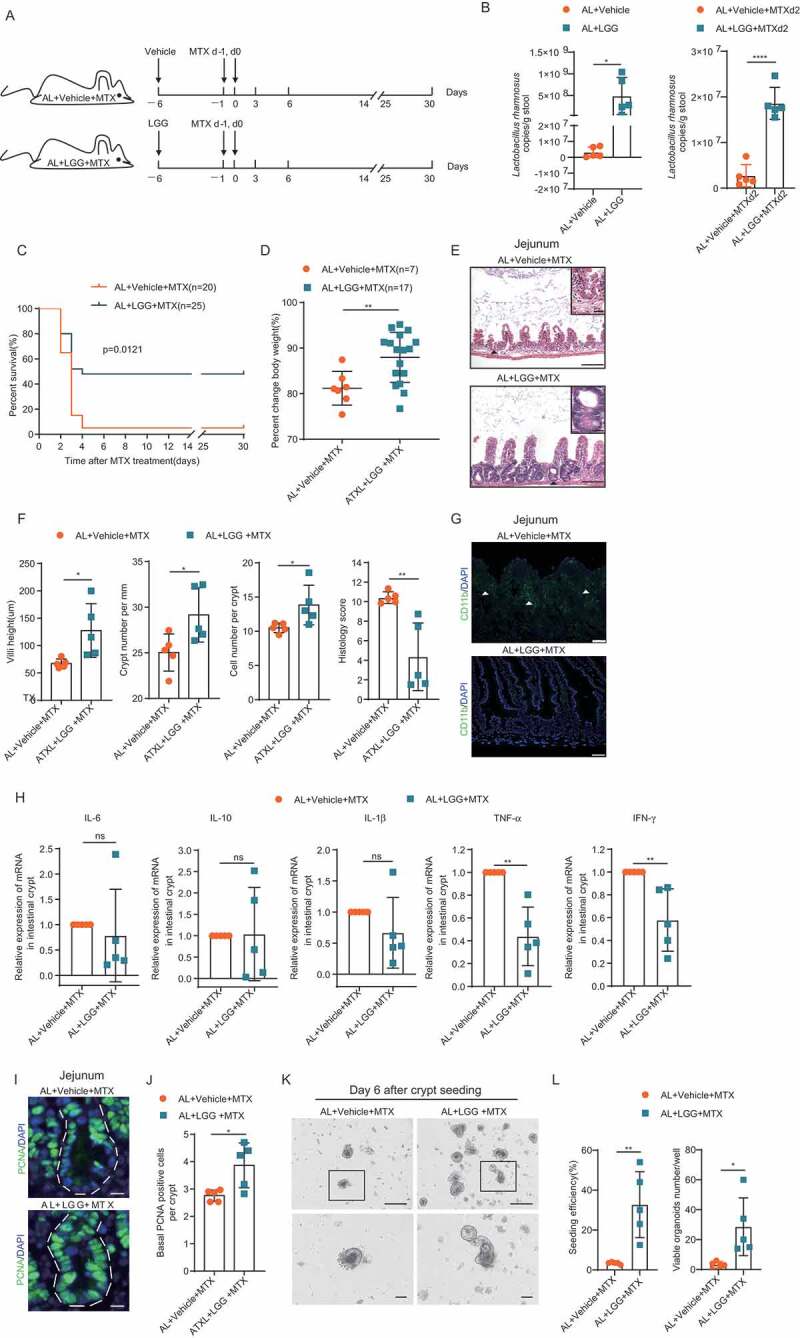
Figure 7.

LGG gavage partially rescued the survival of AL mice exposed to high-dose MTX. (A) Scheme of experiment. Two-month-old mice were fed with vehicle control or LGG for 5 days before MTX administration. Then, mice were intraperitoneally injected with the vehicle as control or MTX for 2 days at a dose of 120mg/kg (d-1) and 60mg/kg (d0). All mice were fed with AL diet. (B) qPCR analysis of the amounts of total bacteria and LGG of indicated groups (n = 5 mice per group randomly picked from 2 independent experiments). (C) Survival was monitored daily after MTX administration. Gehan-Breslow-Wilcoxon test. (n = 20–25 mice per group, combined from 2 independent experiments). (D) Percent change of body weight at indicated timepoints after MTX treatment compared to before MTX treatment (n = 7–17 mice per group, combined from 2 independent experiments). (E) Representative images of H&E staining of jejunum on day 3 after MTX administration. Representative crypts are shown in insets. Scale bar: 50μm (outside), 20μm (insets). (F) Villi height (40 crypts were counted for each mouse, n = 5 mice per group randomly picked from 2 independent experiments), crypt number per millimeter (crypt number in 15 mm length was counted as a unit, and 15 units were counted for each mouse, n = 5 mice per group randomly picked from 2 independent experiments), cell number per crypt (30 crypts were counted for each mouse, n = 5 mice per group randomly picked from 2 independent experiments) from jejunum on day 3 after MTX administration were shown. Histology score was based on H&E staining (30 vision fields were counted per mouse, n = 5 mice per group randomly picked from 2 independent experiments) from the whole small intestine on day 3 after MTX administration. (G) Representative images of CD11b+ immunofluorescent staining of jejunum on day 3 after MTX administration. Arrow heads point to CD11b+ cells. Scale bars: 20 μm. (H) Relative expression of indicated genes in freshly isolated crypt cells from the whole small intestine of mice on day 3 after MTX administration by qRT-PCR analysis (n = 5 mice per group randomly picked from 2 independent experiments). (I) Representative images of immunofluorescent staining of PCNA of jejunum on day 3 after MTX treatment. (J) Basal crypt PCNA-positive cell number per crypt of the whole small intestine on day 3 after MTX administration (30 crypts were counted for each mouse, and n = 5 mice per group randomly picked from 2 independent experiments). (K) Representative images of cultured crypts on day 6 in culture derived from mice on day 3 after indicated treatment. Lower line: zoomed in vision of images in square frames of the upper line. Scale bars: 100 μm (upper); 50 μm (lower). (L) Seeding efficiency of cultured crypts on day 3 and number of viable organoids of cultured crypts on day 6 (n = 5 mice per group randomly picked from 2 independent experiments). Results were displayed as mean±SD. n.s; nonsignificant; *: P < .05; **: P < .01; ***: P < .001; ****: P < .0001 by two-tailed, Student’s t test.
