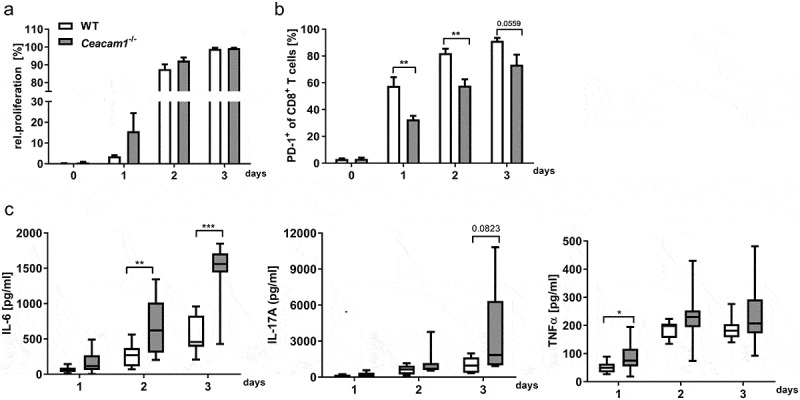
Figure 6.

CD8+ T cells from Ceacam1−/− mice show an enhanced activity in vitro. CD8+ T cells were isolated from the spleen of naïve Ceacam1−/− or WT mice, CFSE-labeled and stimulated with anti-CD3 antibody. (a) Proliferation of CD8+ T cells was determined at indicated time points by flow cytometry and the loss of CFSE dye (n = 4). (b) Percentages of PD1+ CD8+ T cells were measured at indicated time points. (c) Concentration of IL-6, IL-17A and TNFα in the cell culture supernatants was analyzed at indicated time points using Luminex technology (n = 9–10). All data are presented as mean ± SEM. Statistics were performed using the Student’s t-test for individual time points (*,p< .05; **,p< .01; ***,p< .001).
