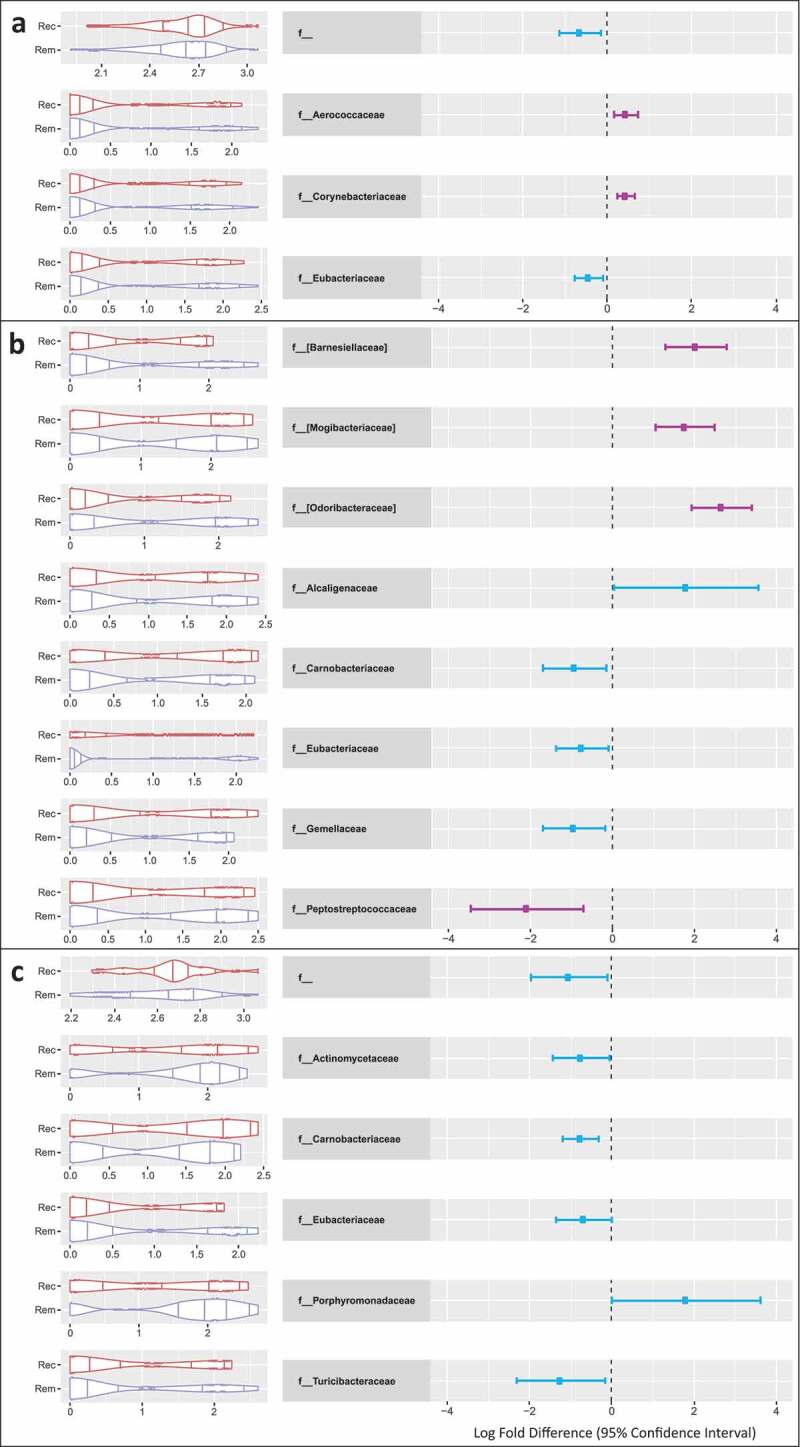
Figure 3.
Cumulative Sum Scaled (CSS) normalized relative count distributions for endoscopic remission and recurrence (left of each figure), and Log2 Fold Difference (right of each figure) of statistically significant taxa at family level for patients with disease recurrence at each endoscopically assessed time point (6 and 18 months). Zero-inflated Gaussian modeling on cumulative sum scaled and normalized data at OTU level, further aggregated at family level, adjusted for age, gender, smoking status, metronidazole tolerance, body mass index, sequencing plate, hospital of origin, and sample timepoint where appropriate. Families that met FDR P Value threshold are shown in purple. Only taxa that met P ≤ 0.05 are reported, FDR Adjusted P Values in are adjusted for number of comparisons.

Panel A: Significant taxonomic findings at family level at all time points in relation to 18 month endoscopic outcome. Panel B: Significant taxonomic findings at family level at 6 months in relation to endoscopic findings at 6 months. Panel C: Significant taxonomic findings at family level at 18 months in relation to endoscopic findings at 18 months.
Rem: Endoscopic Remission (Rutgeerts score i0-1), Rec: Endoscopic Recurrence (Rutgeerts score ≥i2).
